
About this example
This page is part of the literature review chapter of an example thesis in computer vision, on recognising traffic signs from vehicle cameras. It is written at the level expected of a doctoral or research master's thesis and shows how a review can move from the problem, to the requirements a solution must meet, to the approaches tried so far and finally to a research gap.
It is an illustrative teaching example, not a real student's work. Do not submit any part of it as your own work; your university's academic integrity rules apply.
The example: why traffic sign recognition is hard
2.1 Scope of the review
This chapter reviews research on the automatic detection and recognition of traffic signs in images taken from moving vehicles. Detection locates a sign in the image; recognition assigns it to a class such as "speed limit 50" or "give way". Sources were identified through structured searches of digital libraries using combinations of "traffic sign", "detection", "recognition" and "deep learning", with backward citation searching, following the planning stages recommended for literature reviews in computing (Kitchenham & Charters, 2007). The review is a structured narrative review rather than a systematic review (Grant & Booth, 2009): its aim is to map the challenges and approaches, not to pool results.
2.2 Conditions on the road
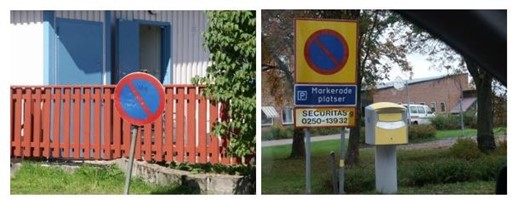
Signs in use are rarely in the clean, front-facing condition of a reference image. Sunlight and paint oxidation fade their colours over time, and edges corrode or bend. Mist, rain, cloud and snow reduce visibility, while the direction and intensity of light change with the time of day and the season, so that the same red border can appear in very different colours. Shadows from trees and buildings fall across signs, and other objects partly hide them. Objects of similar colour or shape, such as fences or post boxes, can be mistaken for signs (Figures 1 and 2).
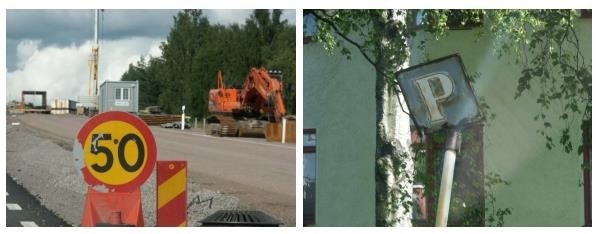
The camera adds its own difficulties. The size of a sign in the image depends on its distance from the camera, so the same sign may cover a few pixels or a large area. Viewing angle rotates and distorts the shape. Movement of the vehicle causes motion blur, and reflective sign surfaces can return sunlight or headlights as bright highlights that hide the pictogram (Figures 3 to 5).
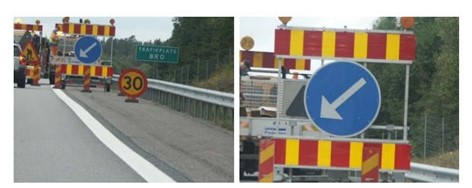
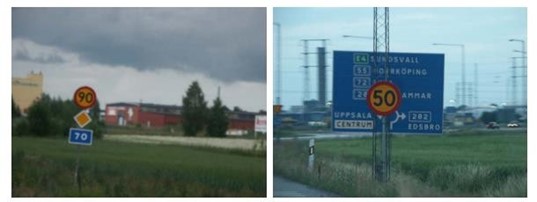
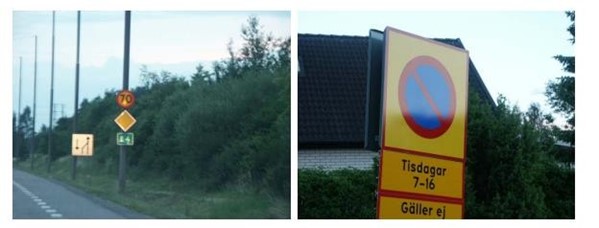
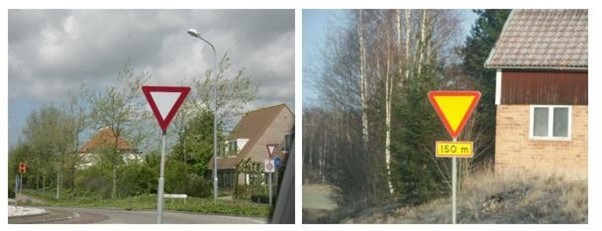
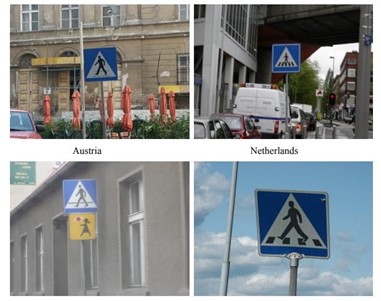
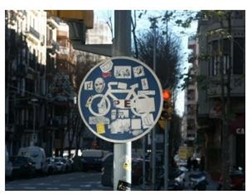
Finally, signs differ between countries and change over their lifetime. The same instruction may use a different colour scheme or pictogram in neighbouring countries, so a model trained on one country's signs may not transfer to another, and stickers or graffiti can alter the pictogram (Figures 6 to 8).
The example: requirements and approaches
2.3 Requirements for a robust system
The conditions above translate into requirements. A practical system must be robust to noise and to changes in illumination; invariant to translation, scale and in-plane and out-of-plane rotation; tolerant of partial occlusion and damage; able to detect small, distant signs; fast enough for the vehicle's speed on the available hardware; and transferable across countries, or at least easy to retrain.
2.4 Approaches in the literature
Published work falls into four broad families, summarised in Table 2.1. Early systems used colour and shape: they segmented likely sign colours, often in colour spaces such as HSV that separate hue from brightness, and then tested candidate regions for circles, triangles or octagons. These methods are fast but sensitive to lighting and fading. A second family extracted hand-crafted features, such as histograms of oriented gradients, and classified them with support vector machines; this improved robustness but depended on feature design. Since convolutional neural networks showed large gains in general image classification (Krizhevsky et al., 2012), most recent work learns features directly from data, either classifying cropped signs or detecting and classifying them in one network. A fourth, more recent strand designs lightweight networks that can run in real time on in-vehicle hardware.
| Family | Typical techniques | Addresses well | Remaining weakness |
|---|---|---|---|
| Colour and shape based | Colour thresholding (e.g. HSV), shape tests | Speed; simple scenes | Lighting changes, fading, occlusion |
| Hand-crafted features with classifiers | Gradient-histogram features with SVMs | Moderate robustness; small data | Depends on feature design; limited to sign shapes it was built for |
| Deep learning classifiers and detectors | CNN classifiers; region-based and single-stage detectors | Accuracy on varied images; joint detection and recognition | Small distant signs; need for large labelled data |
| Lightweight deep models | Compact CNN architectures, model compression | Real-time use on limited hardware | Some loss of accuracy; less tested in adverse conditions |
The example: evaluation problems and the research gap
2.5 How results are evaluated
Comparisons between published systems are harder than reported accuracies suggest. Benchmark datasets often contain several images of the same physical sign taken from consecutive video frames; if these are split randomly, near-identical images appear in both training and test sets and performance is overstated, a form of leakage (Kapoor & Narayanan, 2023). Some sign classes are far rarer than others, so overall accuracy can hide poor performance on rare but important signs, and precision-recall analysis is more informative (Saito & Rehmsmeier, 2015). Deep models can also be misled by small, deliberately designed changes to the input, including changes that can be made physically, such as stickers (Vassilev et al., 2025). Finally, many studies do not release code or full training details, which limits reproduction (Liu et al., 2022; Pineau et al., 2021).
2.6 Research gap
Traffic signs carry information that drivers can miss through fatigue or distraction, and automated recognition is a component of driver-assistance and automated driving systems. The review shows that deep learning approaches handle varied images well, but three gaps remain. First, few studies test performance specifically under the adverse conditions described in 2.2, such as heavy rain, glare or partial occlusion, as separate conditions. Second, cross-country transfer is rarely evaluated. Third, the trade-off between accuracy and speed on in-vehicle hardware is seldom reported together with robustness. This thesis addresses the first and third gaps by evaluating lightweight detectors on test sets stratified by condition.
How to adapt this to your own study
- State the scope, the type of review and how you searched in the first paragraph.
- Group the problem into a few categories that later sections can address.
- Turn the problem into precise requirements, using the technical terms of your field.
- Review the literature by approach family or theme, and judge each against the requirements.
- Check every summary and limitation against the paper it describes.
- Include a short critique of how results in the field are evaluated.
- Derive the gap from the review and say which part of it your thesis addresses.
Common mistakes in this chapter
- Summarising one study after another without grouping or comparison.
- Copying a limitation or result from one study onto another.
- Using technical terms incorrectly ("irreversibility" for invariance).
- Quoting statistics, such as road deaths, without a current authoritative source.
- Treating reported accuracies from different datasets and splits as comparable.
- Citing works that are not in the reference list, or listing works never cited.
- Stating a gap that does not follow from the review.
| What examiners look for | Where this example does it | Check in your own draft |
|---|---|---|
| Clear scope and search approach | 2.1 | Could another researcher repeat your search? |
| Synthesis, not a list | 2.2 grouped challenges; Table 2.1 by family | Are studies compared and grouped? |
| Accurate technical language | 2.3 requirements in standard terms | Would a specialist accept every term? |
| Critical appraisal of evidence | 2.5 on leakage, imbalance and reproducibility | Do you question how results were obtained? |
| A gap that follows from the review | 2.6 builds on 2.2 to 2.5 | Is your gap visible in your own review? |
| Quality of a narrative review | Scope, sources and argument stated | Score your draft against SANRA (Baethge et al., 2019). |
Key takeaways
- State scope, review type and search approach first (Grant & Booth, 2009; Kitchenham & Charters, 2007).
- Organise challenges into categories and turn them into precise requirements.
- Review by approach family and judge each against the requirements.
- Check evaluations for leakage, imbalance and reproducibility (Kapoor & Narayanan, 2023; Saito & Rehmsmeier, 2015; Pineau et al., 2021).
- Derive the gap from the review itself (Müller-Bloch & Kranz, 2015).