Basic
For straightforward studies that need descriptive and simple inferential results checked and reported.
From$149
Delivered in 5 to 7 working daysChoose Basic- Regression and multivariable models
- Reporting guideline checklist

Mentoring to check, report and justify the statistics in your journal manuscript before you submit.
Struggling to report the statistics in your journal manuscript? Whether you work in medicine, engineering, the social sciences or management, your mentor, a statistician in your field, reviews your methods and results against the target journal's requirements and recognised reporting guidelines, and helps you present effect sizes, confidence intervals, tables and figures clearly and accurately.
Clear, correct statistical reporting is essential for publication. Yet many manuscripts present data poorly: methods are under-described, tables and figures are hard to read, and visuals obscure the key findings. PhD Research Lab mentors researchers in reporting statistical methods and results for quantitative, qualitative and mixed-methods studies, so that the analysis, its interpretation and the Results section match the research objectives and the expectations of peer-reviewed journals.
Poor statistical reporting is a widespread, long-standing problem in academic publishing. Reviews of the published literature have repeatedly found errors in how statistics are applied, interpreted and reported, and such errors can undermine a study's conclusions. From a flawed analysis plan to a misused inferential test, statistical problems can delay publication or lead to rejection.
Your mentor is a statistician with experience of copyediting, statistical reporting and research methodology in your discipline. They explain concepts rather than just supplying output, and guide you on how to interpret, present and defend your results to editors and reviewers.
A review before submission catches mismatched numbers, unsuitable tests, unchecked assumptions and missing information in Methods and Results.
Results that report effect sizes with confidence intervals, not only p-values, are easier for reviewers to judge and readers to use.
Many journals require a completed checklist for the relevant guideline, such as CONSORT for randomised trials, STROBE for observational studies or PRISMA for systematic reviews.
Clearly described methods, software versions and data and code availability let others check and build on your work.
Addressing statistical issues before submission can save rounds of revision, though no service can guarantee acceptance, which is decided by editors and reviewers.
Journals, statistical reviewers and readers look for the same things: the right analysis for the design, honestly and completely reported. Your mentor reviews your manuscript against these standards and records every suggested change with its reason.
Reporting guidelines, collected by the EQUATOR Network, set out what a paper must report for its study design: CONSORT for randomised trials, STROBE for observational studies, PRISMA 2020 for systematic reviews and meta-analyses, STARD for diagnostic accuracy studies, TRIPOD for prediction models, ARRIVE for animal research, and COREQ or SRQR for qualitative research. We check your manuscript against the right checklist and help you fill in the page numbers journals ask for.
The SAMPL guidelines (Statistical Analyses and Methods in the Published Literature, Lang and Altman) give basic rules for reporting statistics in biomedical journals. They ask authors to name and justify each test, confirm its assumptions were checked, report the software used, give exact p-values and report effect sizes with confidence intervals. We use them as a checklist for Methods and Results in any quantitative field.
A p-value alone says nothing about how large or important an effect is. We help you report the estimate that answers your research question, such as a mean difference, odds ratio (OR), risk ratio (RR), hazard ratio (HR), absolute risk difference or standardised effect size, with its 95% confidence interval and units, and interpret it in practical or clinical terms.
The American Statistical Association's 2016 statement on p-values sets out six principles: p-values can show how incompatible data are with a specified model; they do not measure the probability that a hypothesis is true or that the data arose by chance alone; conclusions should not rest only on whether p passes a threshold; proper inference needs full reporting and transparency; a p-value does not measure the size or importance of an effect; and by itself it is not a good measure of evidence. We help you report exact p-values (for example p = 0.032, or p < 0.001 for very small values), avoid describing non-significant results as proof of no effect, and account for multiple comparisons.
We check that each test or model suits your data: normality, homoscedasticity, independence and linearity, residuals, variance inflation factors (VIF) for multicollinearity, influential observations and model fit. Pre-specified sensitivity and subgroup analyses are reported as such, and post hoc analyses are labelled as exploratory.
The amount of missing data, its likely mechanism and how it was handled, such as complete-case analysis or multiple imputation, must be reported. Outliers are investigated and reported, not removed to change a result; any exclusion needs a stated, justified rule and, ideally, a sensitivity analysis with and without them.
Many journals require a data availability statement saying where the data and code can be found, or why they cannot be shared, for example for participant confidentiality. We help you describe software and package versions, share an analysis script where possible, deposit data in a suitable repository such as OSF, Zenodo, Dryad or Figshare, and word the statement to the journal's policy.
We never fabricate, alter or selectively report data or results, and we do not search for analyses that produce significance. Re-analysis is done only with your own data and your approval, and every change is documented so you can explain it to your co-authors, editors and reviewers. Statistical support should be acknowledged in your manuscript, as journals following ICMJE recommendations expect.
We support the statistical content of quantitative, qualitative and mixed-methods manuscripts in clinical, social science, engineering and other fields.
Choosing statistical methods that answer your objectives and hypotheses, selecting suitable models (for example linear, logistic, Cox or mixed models) and developing a statistical analysis plan (SAP) that meets journal and ethical requirements.
Setting out the study design, sample size justification, statistical tests, software and assumptions so that a reviewer could reproduce the analysis.
Turning SPSS, Stata, R, Python or MATLAB output into publication-quality results: descriptive statistics, inferential tests, effect sizes, confidence intervals and p-values, interpreted correctly. Your mentor guides you as you write your own Results and Discussion.
Publication-quality tables and figures in R (ggplot2), Python (Matplotlib, seaborn), Excel or GraphPad Prism, adjusted to each journal's requirements: forest plots, Kaplan-Meier curves, receiver operating characteristic (ROC) curves and correlation matrices, with clear labels, colours and resolution.
Checking the manuscript against CONSORT, STROBE, PRISMA or another relevant guideline, and against analysis transparency, reproducibility and data integrity.
An independent review of your analysis. With your data and approval, we re-run key analyses to check that the reported numbers can be reproduced, and confirm that the interpretation fits the research objectives and conclusions.
Reviewing the assumptions behind each test, running diagnostics such as residual analysis and VIF, and reviewing design features: sampling, control groups, blinding and randomisation.
Survival analysis, multilevel models, meta-analysis, time series and Bayesian inference; handling missing data, confounding, multicollinearity and model diagnostics; and machine learning or predictive models, reported to TRIPOD where relevant.
Reporting thematic, content, framework, grounded theory, narrative or phenomenological analysis, coded in NVivo, ATLAS.ti or MAXQDA, with the transparency that COREQ or SRQR expect.
Formatting ANOVA, regression and survival tables, statistical notation, abbreviations and figures to the journal template and to APA, AMA or journal-specific style.
Help with statistical comments from reviewers: re-running or extending analyses with your data and approval, and drafting point-by-point responses that you review and submit.
Examples from our sample library.
A study of identifying cascading connections between malicious activities in data security. View sample
A research paper on how public health emergencies affect health and well-being. View sample
Approaches to memo writing in grounded theory studies. View sample
Here is what we need from you, what the review covers, and what sits outside this service.
Send these with your request.
Part of every manuscript statistical review order.
Available as add-ons or other services.
Every manuscript statistics order comes with added support from a mentor in your research area.
Your mentor is a statistician with experience in your discipline, such as medicine and clinical research, engineering, computer science and AI, the life sciences, management and finance, or the social sciences and public policy.
We work in SPSS, SAS, R, Python, Stata, Minitab, GraphPad Prism, JMP and Epi Info, and in NVivo, ATLAS.ti or MAXQDA for qualitative data, matching the software your analysis used.
Methodological sources are cited in your journal's style and managed in tools such as Mendeley, Zotero or EndNote, drawing on databases such as Scopus, Web of Science, PubMed, IEEE Xplore, JSTOR and ProQuest.
Where your journal asks for one, we can help you prepare a graphical abstract that summarises the main result accurately.
Before delivery, the review is checked for consistency between text, tables and figures and for clear language.
Where access and copyright allow, we share the methodological articles cited, so you can read the sources yourself.
Research journeys are rarely straightforward, with hurdles, surprises, hard work, beginnings and endings. PhD Research Lab travels this journey with you, mentoring researchers worldwide.
“I have the SPSS output, but I'm not sure how to interpret the statistics or describe the results.”
Your mentor explains what each number in your output means and helps you report the estimates, confidence intervals and p-values clearly, in the order and format your journal expects.
Usually works best: Hourly mentoring Talk to us“My journal editor has asked me to explain how I ensured the validity and robustness of my statistical analyses.”
We review assumption checks (such as normality and homoscedasticity), reliability measures (such as Cronbach's alpha or the intraclass correlation coefficient) and sensitivity analyses, and help you report them transparently.
Usually works best: Fixed price Talk to us“I used logistic regression, but my reviewer asked me to justify it and explain how it relates to my research model.”
We walk you through how to present and justify your method so that it follows from your research question, design, outcome type and theoretical model.
Usually works best: Hourly mentoring Talk to us“I have collected data from my study, but I'm not sure which statistical tests are best for my manuscript.”
We help you identify the tests that fit your research questions, your independent and dependent variables and the structure of your data, and run them with you on your own dataset.
Usually works best: Fixed price Talk to usScenarios are illustrative, based on requests we often receive from researchers.
We offer manuscript statistics support at three levels for quantitative and qualitative studies. Prices depend on your design, discipline and deadline, and every package starts with a free quote.
Prices in USD, PhD level shown. Master's is 15% lower; postdoc and faculty 15% higher. Your exact price is confirmed in a free quote.
For straightforward studies that need descriptive and simple inferential results checked and reported.
For most journal manuscripts with group comparisons, regression or established qualitative approaches.
For complex models, mixed-methods studies and manuscripts for demanding journals.
One single point of contact (SPOC) stays with you through every step, so you always know who to ask.
PhD Research Lab frames every manuscript statistical review to your target journal's author guidelines, the reporting guideline that fits your study design and your institution's research integrity policy. Our mentors have supported researchers at universities around the world, including the UK, the USA, the Netherlands, Australia, the UAE, Kenya, Nigeria, China and Russia. We never fabricate, alter or selectively report results: any re-analysis uses your own data and is done only with your approval, and every decision is documented so you can explain it to editors and reviewers.
*Where access and copyright allow.
In their own words: scholars on working with PhD Assistance Research Lab.
I was unsure how strong my conclusions were. The reviewers validated my statistical interpretations and helped me improve how I explained my limitations, assumptions and implications. Their input improved my manuscript's scientific credibility a great deal.
We have supported PhD projects for scholars around the world, and every task follows the same checks. These are real screens from our workflow.
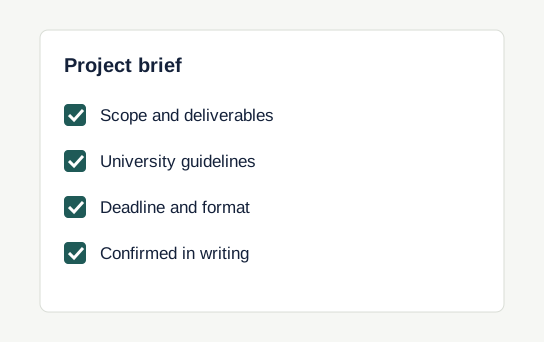
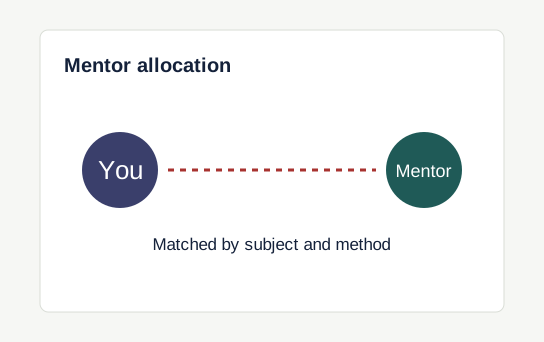
Yes. You can contact your mentor by email, video call or chat, and our project coordinator can schedule meetings when the project starts.
Preliminary analysis (data cleaning, transformations, outlier and missing-data handling), primary analysis (variables, objectives, the smallest effect of practical importance and the results) and supplementary analysis (assumption checks, sensitivity and subgroup analyses), all reported in journal-ready tables and figures.
The tests your design and data call for, including descriptive statistics; t-tests, ANOVA, ANCOVA, MANOVA and chi-square tests; non-parametric tests such as Mann-Whitney U, Wilcoxon and Kruskal-Wallis; Pearson, Spearman and Kendall correlation; linear, logistic and multilevel regression; exploratory and confirmatory factor analysis and SEM; time series and survival analysis; meta-analysis; and Bayesian methods.
No. We never fabricate, alter or selectively report data or results. If an analysis needs to be corrected or re-run, we explain why, do it only with your own data and approval, and document every change.
No. Acceptance is decided by editors and reviewers. A careful statistical review removes avoidable errors and makes your results easier to assess.
Yes. If reviewers commented on your statistical analysis, we can help you revise, re-analyse (with your data and approval) and reformat the statistical sections, and draft responses for you to review.
Yes. Journals that follow ICMJE recommendations expect contributors who do not meet authorship criteria, including statistical advisers, to be acknowledged. Your mentor can suggest wording.
Prices depend on your design, discipline and deadline. Our project coordinators can tell you about current seasonal discounts and referral offers.
Revisions within the agreed scope of your package are included, including changes requested by your university or journal. Please read our terms and conditions when you place an order.
Prefer to do it yourself? Our Academy courses teach the same methods our mentors use, step by step.