
Introduction
Summary
Choosing between structural equation modelling (SEM) and regression depends on your research objective and how your variables are measured. This guide provides a practical decision tool, a worked thesis example and guidance on selecting an SEM approach, assessing sample adequacy and defending your statistical method.
SEM vs regression is not a contest between a basic and an advanced statistical method. Regression estimates relationships among observed variables, while in addition to structural modelling, SEM can also model latent variables based on their observed indicators. This depends on what you want to model, the representation of your variables, and whether your data can fit into the model.
Structural Equation Modeling (SEM) vs Regression Analysis
Multiple regression estimates the effect of one variable on another. It is suitable for research questions involving observed measurements, such as age, income, examination scores or defensible questionnaire composites.
Structural equation modelling can combine a measurement model, which links indicators to constructs, with a structural model, which estimates relationships among variables or constructs. Latent-variable SEM can explicitly model measurement error under its assumptions, whereas ordinary regression using composite scores generally treats those scores as observed measurements.
Research feature | Regression | SEM |
Variables | Observed variables or composite scores | Observed variables and, where justified, latent constructs |
Primary purpose | Estimate relationships or predict outcomes | Model measurement and relationships within a specified framework |
Measurement error | Not usually modelled explicitly for each score | Can be modelled in a latent-variable measurement model |
Mediation | Can estimate direct and indirect effects | Can estimate effects within a broader structural model |
Evaluation | Coefficients, assumptions, residuals and predictive performance | Measurement quality, fit where applicable, residuals and parameter estimates |
SEM is not automatically superior. If regression answers the research question adequately, a more complex model may increase the analytical burden without improving the conclusions. The method should follow the research design, not the desire to use an advanced statistical technique. [5]
How to Choose Between SEM and Regression for Your Thesis
A common thesis-design mistake is choosing the statistical method before deciding how the variables will be represented. Using a validated questionnaire does not automatically require latent-variable SEM, and having several hypotheses does not automatically justify a complex structural model.
Use the following decision matrix to identify an appropriate starting method.
Research objective | Measurement approach | Starting method |
Estimate relationships between variables | Observed variables | Multiple regression |
Test mediation using established scale scores | Defensible composite scores | Regression-based mediation |
Evaluate questionnaire items as indicators of constructs | Latent variables with specified indicators | Confirmatory factor analysis (CFA) |
Examine relationships among latent constructs | Latent measurement and structural models | Structural equation modelling |
Prioritise out-of-sample prediction | Observed or composite predictors | Compare suitable predictive methods |
These recommendations are starting points rather than automatic decisions. The researcher must still justify the measurement specification, examine the data and establish that the selected method supports the intended inference.
A four-step decision framework
Step 1: Define the research objective. Determine whether you want to estimate relationships, test mediation, evaluate a measurement structure or prioritise prediction. The number of hypotheses alone does not determine the method.
Step 2: Specify how variables are measured. Classify each variable as an observed variable, a composite score, or a latent construct measured via multiple indicators. When the quality of measurement and measurement errors become essential components of your research problem, latent-variable modelling might be suitable.
Step 3: Evaluation of data and model adequacy. Consider sample size, expected effect sizes, model complexity, missing data, estimator assumptions and model identification. Avoid relying on universal sample-size rules. SEM estimation performance varies with the model, population characteristics and estimation conditions. [1, 2]
Step 4: Match evaluation to the method. It is necessary for assumptions to be tested and for coefficients to be presented clearly in regression analyses. For structural equation modelling, measurement, test of model fit where applicable, and checking of the residuals and parameter estimates could also be needed.
The goal here is to select the simplest procedure that can answer the research question.
SEM vs Regression in a Thesis: A Worked Example
Consider a thesis asking: Does service quality influence customer loyalty through customer satisfaction? The research question remains unchanged, but the measurement design can lead to different methodological choices.
Model A: Established composite scores
The researcher calculates service-quality, satisfaction and loyalty scores using defensible scoring procedures. The objective is to estimate relationships between these scores and test whether satisfaction mediates the relationship between service quality and loyalty.
Regression-based mediation is a reasonable starting point. The researcher estimates the relevant paths and indirect effect, checks assumptions and reports an appropriate confidence interval, such as one obtained through bootstrap resampling.
A full latent-variable SEM is not automatically necessary simply because the conceptual framework includes three constructs. If the composite scores adequately represent the variables for the intended analysis, regression may be sufficient.
Model B: Multiple indicators per construct
The researcher uses individual questionnaire items as indicators of service quality, satisfaction and loyalty. The thesis must evaluate whether these indicators adequately represent the proposed constructs before interpreting relationships among those constructs.
CFA followed by a justified structural model may be appropriate. The researcher evaluates the measurement model and proceeds to the structural relationships if the specification and measurement evidence support that decision.
What changes? Not the research question, but the analytical requirement. Model A focuses on relationships among observed scores. Model B additionally examines the measurement structure. The second approach is justified when that structure is substantively important and adequately supported by the data—not simply because SEM is more complex.
CB-SEM vs. PLS-SEM: Which Approach to Choose?
If the justification for SEM exists, the next question to be addressed is which approach fits the measurement model, purpose of research and the kind of inferences to make.
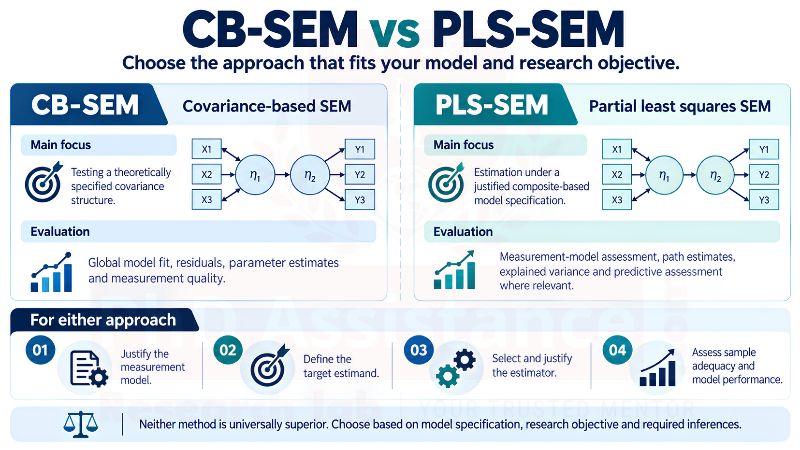
Use these principles when deciding which approach to evaluate:
- Consider CB-SEM when evaluating a theoretically specified covariance structure is central to the research.
- Consider PLS-SEM when the composite-based model specification and research objective support that approach.
- For prediction-focused research, evaluate out-of-sample predictive performance rather than if a particular SEM method will perform better.
- In either case, justify the measurement specification, estimand, estimation procedure and evaluation strategy.
Neither method is a universal solution for small samples, non-normal data or complex models. Sample adequacy depends on model complexity, effect sizes, measurement quality, estimator and the precision required. Power analysis or model-specific simulation can provide a stronger rationale than generic rules. [1, 2]
Comparative research on SEM and regression using weighted composites also illustrates why methodological findings must be interpreted within their specific modelling conditions. It should not be treated as proof that one method universally outperforms the other. [3, 6]
How to Interpret SEM Model-Fit Indices
For an appropriate CB-SEM analysis, researchers commonly report the comparative fit index (CFI), Tucker–Lewis index (TLI), root mean square error of approximation (RMSEA) and standardized root mean square residual (SRMR). Each describes a different aspect of model fit.
- CFI and TLI: Compare the proposed model with a baseline model.
- RMSEA: Assesses approximate fit relative to model degrees of freedom; consider its confidence interval where available.
- SRMR: Summarises standardised discrepancies between observed and model-implied relationships.
Interpret these indices together rather than applying universal cutoffs mechanically. The estimator, sample and data characteristics, model specification and measurement quality all affect interpretation. A model can show apparently acceptable global fit while containing weak indicators, implausible parameter estimates or local residual problems. [4]
A defensible thesis report should state the estimator and its rationale, report relevant fit indices, inspect residuals and parameter estimates, and assess measurement quality. Modifications should have substantive justification rather than being introduced solely to improve fit statistics.
Regression requires different diagnostics, including checks relevant to linearity, residual behaviour, influential observations and multicollinearity. For both methods, report effect estimates and uncertainty—not only whether a p-value crosses a significance threshold.
What Should You Report in Your Thesis?
Your methodology and results chapters should explain why the selected method is appropriate, how it was implemented and what the results establish.
Area | Reporting SEM | |
Method rationale | Research question, outcome and predictors | Theory, measurement model and structural estimands |
Data adequacy | Sample justification, missing data and assumptions | Sample justification, identification, estimator and model complexity |
Measurement | Score construction and relevant reliability evidence | Indicator specification, loadings and measurement-quality evidence |
Model evaluation | Coefficients, confidence intervals and diagnostics | Fit indices where applicable, residuals, parameters and validity evidence |
Hypothesis testing | Direct effects and mediation if tested | Direct, indirect and total effects where specified, with uncertainty |
For either method, acknowledge relevant limitations. Statistical significance alone does not establish causation, and acceptable model fit does not prove that a theoretical explanation is uniquely correct. Ensure that conclusions reflect the research design, assumptions, and strength of the available evidence.
Conclusion
The right choice in SEM vs regression depends on both the research objective and the measurement design. Regression may be sufficient when observed or composite scores adequately represent the variables. SEM is worth evaluating when the measurement structure and relationships among latent constructs are central to the research.
Define the estimand, specify the measurement model, assess sample adequacy and plan the appropriate diagnostics before finalising your method. A clear methodological justification matters more than choosing the most complex technique.
Frequently Asked Question
Is SEM better than regression for a thesis?
No. Regression may be sufficient for observed or composite scores and relationship estimation. SEM is worth evaluating when the research also requires modelling latent constructs and their indicators.
Can regression test mediation using questionnaire scales?
Yes. Regression-based mediation can estimate direct and indirect effects when defensible composite scores address the research question. Researchers should report suitable uncertainty estimates, such as bootstrap confidence intervals for the indirect effect.
When should I use CFA before SEM?
Use CFA when you need to evaluate a specified measurement model linking indicators to latent constructs. If the measurement model is supported and the research also examines relationships among constructs, you can proceed to a structural model where justified.
Should I choose PLS-SEM for a small sample?
Not automatically. Consider the measurement specification, research objective, model complexity, effect sizes, estimator and required precision. Assess sample adequacy for the proposed analysis rather than relying on a generic rule.
Which SEM model-fit indices should I report?
For an appropriate CB-SEM analysis, commonly reported indices include CFI, TLI, RMSEA and SRMR. Interpret them together with the estimator, model specification, residuals, parameter estimates and measurement evidence.
Reference
- Finch, W. H. (2022). SEM estimation in the context of small samples: Comparison of latent variable models, single indicator, regularized 2-stage least squares and observed variable models. General Linear Model Journal, 46(1). https://doi.org/10.31523/glmj.046001.001
- Wolf, E. J., Harrington, K. M., Clark, S. L., & Miller, M. W. (2013). Sample size requirements for structural equation models: An evaluation of power, bias, and solution propriety. Educational and Psychological Measurement, 73(6), 913–934. https://doi.org/10.1177/0013164413495237
- Yuan, K.-H., & Fang, Y. (2023). Which method delivers greater signal-to-noise ratio: Structural equation modelling or regression analysis with weighted composites? British Journal of Mathematical and Statistical Psychology, 76(3), 646–678. https://doi.org/10.1111/bmsp.12293
- Goretzko, D., Siemund, K., & Sterner, P. (2024). Evaluating model fit of measurement models in confirmatory factor analysis. Educational and Psychological Measurement, 84(1), 123–144. https://doi.org/10.1177/00131644231163813
- Gefen, D., Straub, D., & Boudreau, M.-C. (2000). Structural equation modeling and regression: Guidelines for research practice. Communications of the Association for Information Systems, 4, Article 7. https://doi.org/10.17705/1CAIS.00407
- Schuberth, F., Schamberger, T., Rönkkö, M., Liu, Y., & Henseler, J. (2023). Premature conclusions about the signal-to-noise ratio in structural equation modeling research: A commentary on Yuan and Fang (2023). British Journal of Mathematical and Statistical Psychology, 76(3), 682–694. https://doi.org/10.1111/bmsp.12304