

Simplifying the PhD Journey: Expectations, choosing a Program and Advisor, Writing and Defending Your Dissertation
January 7, 2024
Addressing the Shortfall: Mastering Research Identifications in Medical Science.
January 7, 2024How to Interpret your regression output in management PhD research
Introduction
Regression Analysis: An Overview
Regression analysis is a statistical tool for modelling and analyzing variable relationships. The primary purpose of regression analysis is to estimate the values of one variable (the dependent variable) using the values of other variables (the independent variables). The following are some important characteristics of regression analysis:
- Dependent variable: The dependent variables predict or explain the variable of interest, often known as the response or target variable.
- Independent variables: The variables are used to predict or explain the dependent variable. They are also known as predictors or explanatory variables.
- Regression model: The relationship between the dependent and independent variables is described by a mathematical equation.
- Model fitting: The process of estimating the regression model’s parameters in order to minimize the difference between the observed and predicted values of the dependent variable.
❖ Check our PhD Data Analysis examples to learn about how we review or edit an article for Data Analysis.
Interpreting regression output in performance management PhD research proposal involves understanding the key components of the linear regression analysis and drawing meaningful conclusions from the results. Here’s a step-by-step guide:
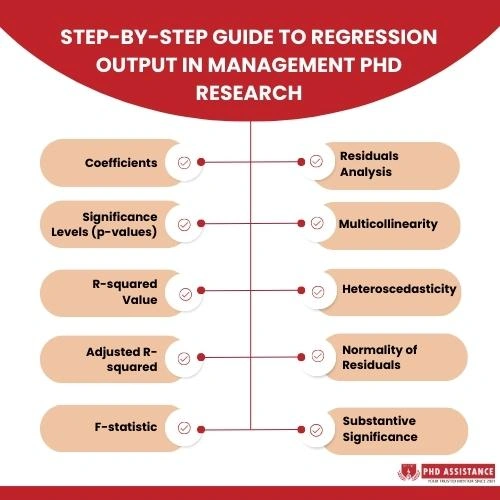
- Coefficients: Look at the coefficients of the independent variables. These represent the estimated impact of each independent variable on the dependent variable, holding other variables constant. A positive coefficient indicates a positive relationship, while a negative coefficient suggests a negative relationship.
- Significance Levels (p-values): Check the p-values associated with each coefficient. A low p-value (typically below 0.05) indicates that the variable is statistically significant. If a p-value is high, it suggests that you cannot reject the null hypothesis that the variable does not affect the dependent variable.
- R-squared Value: Examine the R-squared value, which represents the proportion of the variance in the dependent variable explained by the independent variables. A higher R-squared indicates a better fit of the model to the primary data collection.
- Adjusted R-squared: This value adjusts the R-squared for the number of predictors in the model. It’s often considered a more reliable measure when comparing models with different numbers of predictors.
- F-statistic: The F-statistic tests the overall significance of the logistic regression model. A low p-value for the F-statistic indicates that at least one independent variable is significantly related to the dependent variable.
- Residuals Analysis: Examine the residuals (the differences between the observed and predicted values). A well-fitted model should have residuals that are randomly distributed and show no pattern. Patterns in residuals might suggest that the model is missing some explanatory variables.
- Multicollinearity: Check for multicollinearity among independent variables. High correlation between independent variables can make it difficult to isolate the individual effect of each variable.
- Heteroscedasticity: Assess whether the variance of the residuals is constant across all levels of the independent variables. Heteroscedasticity could indicate that the model’s assumptions are not met.
- Normality of Residuals: Verify that the residuals are normally distributed. You can use quantitative statistical tests or visual inspections (like a Q-Q plot) for this purpose.
- Substantive Significance: Beyond statistical significance, consider the practical or managerial significance of your findings. Even if a variable is statistically significant, it may not be practically significant.
Remember that interpretation may vary based on the specifics of your research question and dataset. It’s essential to integrate statistical results with theoretical and practical insights to draw meaningful conclusions in the context of your phd in management research.
❖ Check out our study guide to learn more about What are the Struggles while Writing a Research Proposal.
Conclusion:
In conclusion, the minitab regression analysis conducted in this management PhD research provides valuable insights into the relationships between variables. The coefficients and their significance levels offer evidence of specific impacts, while the R-squared and adjusted R-squared values gauge the model’s overall explanatory power. The F-statistic contributes to the assessment of the model’s significance, and a thorough examination of residuals ensures the model’s robustness. Attention to multicollinearity, heteroscedasticity, and normality of residuals further refines the interpretation. Integrating statistical findings with theoretical frameworks and practical considerations enhances the substantive significance of the research, reinforcing its contribution to the management field.
About PhD Assistance
PhD assistance focuses on writing research proposals for Ph.D. degrees, which are crucial for the application process and are used by many international universities to determine acceptance offers for DBA/Doctoral programs. They assist in framing these proposals according to standard guidelines and have assisted students from various countries, including the UK, USA, Netherlands, Australia, UAE, Dubai, Kenya, Nigeria, China, and Russia. They adhere strictly to university guidelines and have a plagiarism and tolerance policy, ensuring original papers are sent to clients.
References
- Fey, Carl F., Tianyou Hu, and Andrew Delios. “The Measurement and communication of effect sizes in management research.” Management and Organization Review1 (2023): 176-197.
- Prabha, R., and K. Dhanalakshmi. “Using Regression Analysis to Establish the Relationship Between Perception on Outcome-Based Education and Employability Skills among Postgraduate Students.” Journal for ReAttach Therapy and Developmental Diversities1 (2022): 50-57.