

Appropriately referencing sources used in a PhD dissertation
July 5, 2018The transition of the PhD landscape: Is the world coming up with several PhDs?
July 17, 2018Multiple Regression for your Phd Research – PhD Assistance
What is Multiple Regression?
Multiple regression being an extension of the linear regression predicts the unknown value of the dependant variable from the known value of two or more exploratory predictors or independent variable. An excellent example of multiple regression is the calculation of the yield of wheat per acre. Here the unknown exploratory variable is the total yield, which depends on the quality of seeds, soil fertility, amount of use of pesticides and fertilizers, rainfall, and temperature. One can even find out the individual influence of each known variable on the total yield.
Types of Multiple Regression analysis:
Multiple linear regression strategies depend on the nature and variables of the research. The types of regression analysis rely on the way of entering the variables in the regression equation, which include:
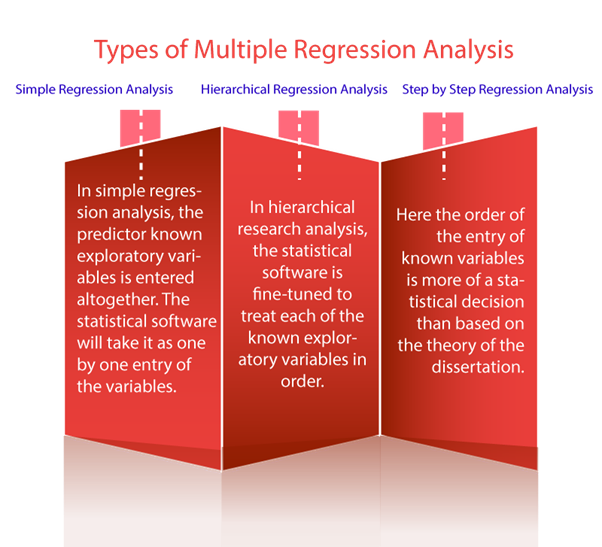
- Simple Regression Analysis:
In simple regression analysis, the predictor known exploratory variables is entered altogether. The statistical software will take it as one by one entry of the variables.
- Hierarchical Regression Analysis:
In hierarchical research analysis, the statistical software is fine-tuned to treat each of the known exploratory variables in order.
- Step by step regression analysis:
Here the order of the entry of known variables is more of a statistical decision than based on the theory of the dissertation.
How to determine the particular type of multiple regression analysis strategies for research in PhD studies?
The type of multiple regression model to use for analyzing the data depends on the topic or question or theory of the dissertations. It may be summarized as follows:
- If the dissertation is based on theories of a particular order, then hierarchical regression will suit for the analysis.
- If the research paper is not in the precise order of entry for the unknown predictor variables, then simple dissertation is appropriate.
- Step by step regression is the most used multiple regression analysis. It is because it often capitalizes on chance and the results will not generalize like the other similar samples. The type of regression is readily available in most of the software packages having drop-down menu features.
- As soon as the formation of a regression equation, it is easy to check it in terms of predictive ability by examining the coefficient of determination or R 2. The thumb rule for good dissertation is for the R2 to be between the range of 0 – 1. The best multiple regression is one with R2 as close to 1 as possible.
Values used for multiple regression analysis and their application
- R-Squared denotes the variable that is discussed in the model. It is the extent to which your input variables talk about the variation of your output.
- ANOVA table is used in order to compare mean differences between 2 or more groups. It performs this action by looking at variations in the data and the place of variation.
- ANOVA computes a statistics test (the F-ratio). F-ratio explains whether the entire regression model is a good fit or not for the data.
- Predicted model coefficients table comprises the following predictors: t-value and p-value. These values help to know whether each variable is substantially estimating the dependent variable.
- Beta (β) coefficients are the estimated coefficients of independent variables. This table also contains the interval estimator of independent variable.
PhD Assistance is world’s reputed academic guidance provider and has guided more than 4,500 PhD scholars and 10,500 master’s students all over the world. We support students, entrepreneurs, research scholars, and professionals in offering high-quality writing and data analytics services. We work on a wide range of subjects which comprise Business Management, Economics, Epidemiology, Public Health, Life Science, and Nutrition.
Check our data analysis examples to know more how a data analysis is carried out for various studies