
What Sensitivity Analysis Actually Measures
Sensitivity analysis studies how uncertainty in a model's output can be apportioned to different sources of uncertainty in its inputs [1]. In engineering terms: if material stiffness, load, mesh size or a hyperparameter shifts, how much does the reported outcome move, and which input matters most?
Local versus global approaches
Local methods perturb one input at a time around a nominal value. They are quick, but they describe behavior only near that point and miss interactions between inputs. A review of published practice cautioned that one-at-a-time designs remain common even though they explore a shrinking share of the input space as the number of inputs grows [2]. Global methods vary all inputs together across their plausible ranges, which is why journals increasingly expect them.
Five steps of a sensitivity analysis
Figure 1 outlines the workflow, and the steps below explain each stage.
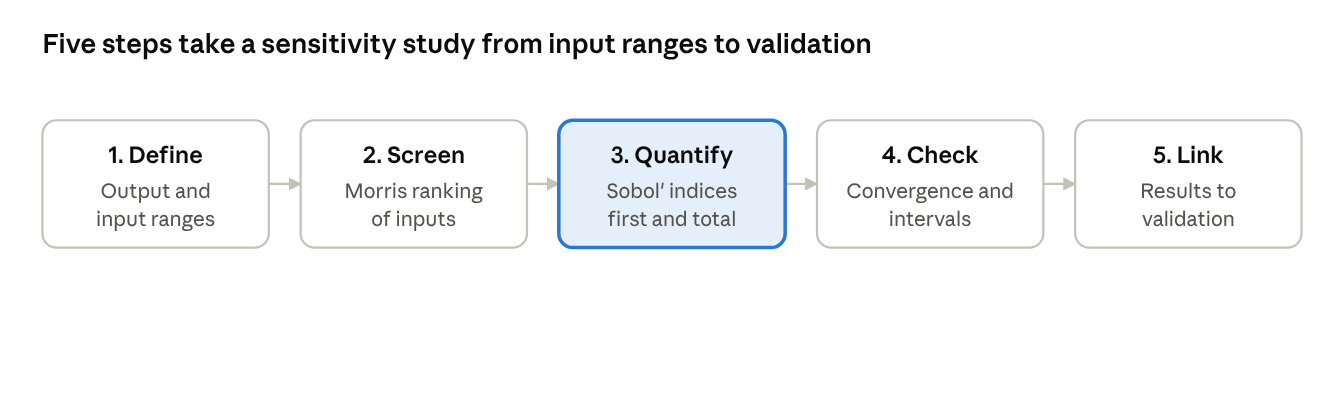
Step 1: Define the output and the input ranges
Choose the quantity of interest, such as peak stress, efficiency or RMSE. Then assign every input a justified range or probability distribution drawn from literature, calibration data or measurement tolerance. Reviewers will ask where each range came from, so document it.
Step 2: Screen the inputs
When the model is expensive or has many inputs, Morris elementary-effects screening offers a low-cost ranking [3]. It separates the few influential inputs from the many negligible ones before heavier analysis begins.
Step 3: Quantify with variance-based indices
Sobol' indices decompose output variance [4]. The first-order index is the share of variance caused by one input alone. The total-order index adds that input's interactions with all others. A large gap between the two signals interaction effects that a one-at-a-time study would never reveal.
Step 4: Check convergence
Report confidence intervals, for example through bootstrapping, and show that the indices stabilize as the sample size grows. Negative or unstable estimates usually mean too few model runs. Without this evidence, a reviewer cannot tell whether a ranking reflects the model or merely the random sample.
Step 5: Link the results to validation
Sensitivity analysis does not replace verification and validation [5]. It tells you where validation effort and measurement accuracy deserve the most attention.
A Worked Illustration
Consider a simple, simply supported beam model whose midspan deflection depends on load, span, elastic modulus, section height and section width. Figure 2 shows illustrative Sobol' indices for such a model. The values are hypothetical and are included only to show how results are presented, not as findings from a specific study.
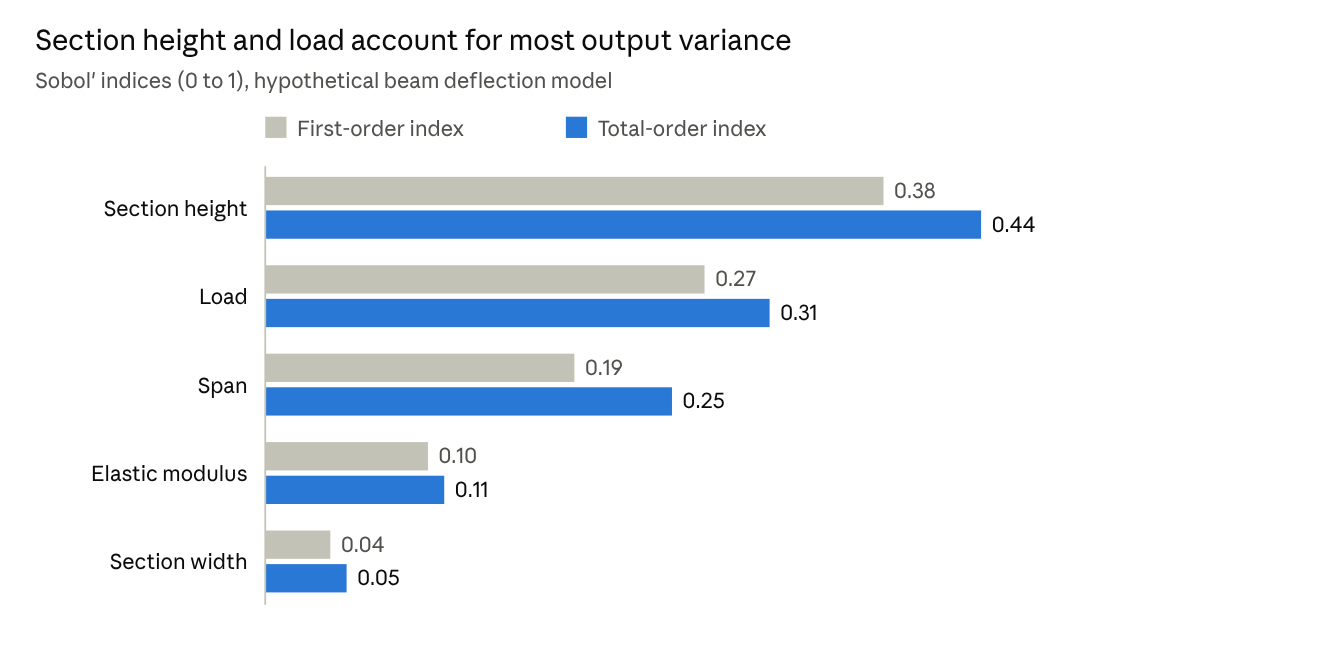
Section height and load dominate the output variance, while width contributes little. The gap between first-order and total-order values for span points to interaction, so a reader learns where design tolerances matter most. Table 1 summarizes how the main methods differ [6].
| Method | Question it answers | Computational cost | Best used when |
|---|---|---|---|
| One-at-a-time (local) | How steep is the response near the nominal point? | Lowest | A quick preliminary check |
| Morris screening | Which inputs matter at all? | Low to moderate | Many inputs, costly model |
| Sobol' indices | How much variance does each input and interaction explain? | High, often thousands of runs | Final quantification for the manuscript |
How to Report It in a Manuscript
- State the method, software and sampling scheme in the methodology section.
- Justify every input range or distribution with a source.
- Present indices with confidence intervals in a table or bar chart.
- Explain the physical meaning of the dominant inputs in the discussion.
- Acknowledge limitations, such as assumed input independence.
Common Pitfalls to Avoid
- Choosing ranges so narrow that nothing appears influential.
- Treating correlated inputs as independent without comment.
- Ignoring numerical noise, such as mesh or solver error, which can masquerade as sensitivity.
- Presenting a ranking without any uncertainty on the indices.
A common reporting gap
In manuscripts we review, the computation is often sound, but the input ranges, sampling choices and intervals are missing from the text. Fixing the reporting is usually faster than redoing the analysis, and it answers the reviewer’s robustness question before it is asked.
Frequently asked questions
What is the difference between local and global sensitivity analysis?
Local methods vary one input at a time near a nominal value; global methods vary all inputs across their ranges and capture interactions.
How many model runs do Sobol’ indices need?
Often thousands. Increase the sample until the indices and their confidence intervals stabilise.
Where does sensitivity analysis go in a manuscript?
The method, software and sampling scheme go in the methodology section; indices with intervals go in the results; their physical meaning goes in the discussion.
Related reading: Weibull reliability analysis for engineering PhD manuscripts · Statistical reporting guidelines
Key takeaways
- Sensitivity analysis shows how much each uncertain input drives the reported result.
- Prefer global methods; one-at-a-time checks miss interactions.
- Screen many inputs with Morris, then quantify the important ones with Sobol’ indices.
- Show convergence and confidence intervals, or reviewers cannot trust the ranking.
- Use the results to focus validation effort, not to replace it.