
Overview
The UAE already screens. Mandatory premarital genetic testing for Emiratis began in early 2025, with MoHAP describing a 570-gene panel covering more than 840 conditions [1]. Subsequent Dubai implementation research has since evaluated a 782-gene sequencing panel [15], so the operational and evidentiary landscape is already evolving. That changes the research question. A PhD proposal can no longer treat the basic implementation of premarital genetic screening in the UAE as an unresolved policy question, and the contribution of consanguinity to recessive risk is well established in the published literature. The more specific research opportunity is narrower and more technical: which genes belong on the panel, at what carrier-frequency threshold, and what genomic evidence should decide that? This blueprint shows how the research question can be translated into a defensible doctoral research design.
Who this is for: PhD applicants and scholars in medical genetics, genetic counselling, bioinformatics, public-health genomics and paediatrics; clinician-researchers; and supervisors shaping candidate projects in the UAE and wider GCC.
Scope and separation of content. This article distinguishes three things throughout: published evidence, cited to source; research hypotheses, which a thesis would test and which are labelled as such; and design guidance from PhD Assistance. It is research-methodology guidance only — not clinical, diagnostic or genetic-counselling advice, and not guidance for anyone’s reproductive, marital or family decisions. It does not assess any individual’s or couple’s risk. Decisions about national screening programmes rest with health authorities. Regulatory and data-access requirements change; confirm them with your research ethics committee and the relevant health regulator before submission.
A note on framing. Consanguineous marriage is a longstanding social practice in the region, and research on it carries real potential for stigma. Throughout this blueprint, consanguinity is treated as a population-genetic variable to be measured, not a behaviour to be evaluated. Section 10 sets out why that framing is also an ethics-committee requirement rather than only a courtesy.
1. Why recessive disease burden is a high-value PhD research area in the UAE
The policy infrastructure now exists, so the research question must now address evidence gaps within that system. Mandatory premarital genetic testing for Emiratis began in January 2025, covering 570 genes and over 840 conditions [1]. Federal Decree-Law No. 49 of 2023 makes premarital genomic screening obligatory, requires evidence of screening before a marriage contract is completed, and provides that the list of genetic diseases to be examined is issued by ministerial resolution (Art. 15) [2]. Because the list is established by ministerial resolution, its composition can be changed through the relevant regulatory process; population-specific genomic evidence is one source of evidence that can inform such an evaluation.
The genomic substrate is documented. A 2025 medRxiv preprint, not yet peer-reviewed, analysing 43,608 Emirati Genome Programme genomes reported elevated median inbreeding coefficients and cumulative runs-of-homozygosity length, largest in groups with Arabian main ancestry and higher than values reported for Qatar, and reconstructed 247 families with third- or fourth-degree consanguineous parents [3]. UAE consanguinity has been reported in the 39–54% range across studies [4].
The disease catalogue is population-specific. The Catalogue for Transmission Genetics in Arabs records 665 distinct genetic conditions described in Emiratis, 621 following clear Mendelian inheritance, with 1,365 gene variants reported. Over half are extremely rare globally and predominantly autosomal recessive. The same analysis found 235 variants absent from dbSNP and ClinVar, and 307 CTGA-pathogenic variants classified differently in ClinVar [5]. Population-specific interpretation is therefore not a theoretical concern.
A regional template exists — and it is not Emirati. In 6,045 Qatari whole genomes, 62.5% of participants carried at least one known pathogenic variant for a recessive condition; homozygosity for a recessive pathogenic variant occurred in roughly 1 in 150 subjects; Peninsular Arabs showed 5.8-fold enrichment for homozygous pathogenic variants relative to other ancestries, and 56 genes exceeded a carrier frequency of 1/50 [6]. That study demonstrates the design is achievable in a Gulf biobank. It also shows what an Emirati equivalent would need to match.
What changed in the UAE evidence base during 2025–2026. Two studies published since the panel launched reset the baseline. Jain et al. analysed 1,194 Emirati exomes alongside 1,333 Arab Emirati families, reported carrier rates including CYP21A2 at 10.6%, HBB at 9.6%, MEFV at 5.9% and ABCA4 at 4.3%, estimated at-risk couple rates of 4–21% depending on the panel assumed, and proposed a provisional Emirati premarital screening gene list of 481 genes — noting that 214 of their 425 additional genes (50%) are not on the 570-gene MoHAP list [14]. Alblooshi et al. then reported a citywide Dubai programme that screened 1,000 couples on a 782-gene panel, of which 558 genes were MoHAP-mandated and 224 were added from a local Emirati clinical genomic database; 79 couples (8%, 95% CI 6.4–9.7) were identified as at risk, and 14 of those 79 (18%) were detected only through the locally sourced genes. Consanguinity or shared ancestry met their threshold in 28.0% (160/572) of whole-genome-sequenced couples [15]. Emirati carrier-frequency estimation is therefore no longer the open question.
The research gap, stated narrowly. Runs of homozygosity analysis in this setting is not an unexplored idea; autozygosity has been characterised in Emiratis at population scale [3], and carrier-burden methods have been demonstrated regionally [6]. A defensible 2026 gap is tighter than “study consanguinity in the UAE”. It is closer to this: the remaining opportunity is not simply to estimate Emirati carrier frequencies, because recent Emirati studies have already produced gene-level carrier estimates and evaluated premarital panel composition. A narrower gap is whether population-scale ROH and FROH patterns, ROH length classes and genomic substructure can be integrated with population-specific carrier-frequency estimates into a prespecified, reproducible framework for evaluating panel composition and threshold sensitivity. Confirm any such statement with a documented systematic search — databases, search strings and date recorded — before submission.
2. Consanguinity is not the same as autozygosity: what genomes measure
This distinction is the conceptual foundation of the whole project, and proposals that blur it tend to be sent back.
Consanguinity is a reported relationship between parents — first cousins, second cousins, or a shared tribal lineage. It is collected by questionnaire, and it yields an expected inbreeding coefficient (F) from pedigree assumptions.
Autozygosity is the observed genomic consequence: the proportion of an individual’s genome present in two identical copies inherited from a common ancestor. It is measured, not reported.
The two diverge for reasons that matter methodologically:
- Pedigree F is an expectation, not a realisation. Because recombination is stochastic, two full first cousins can have genuinely different realised autozygosity. Pedigree-based F assigns them the same value; the genome does not.
- Reported relationships are incomplete. Endogamy over many generations produces background relatedness that no one reports as “consanguineous marriage”, because the common ancestor is too distant to be named.
- Reporting is socially shaped. In a context where the practice is discussed publicly, self-report may be accurate; in others it may not be. Genomic measurement does not depend on disclosure.
The research implication. A thesis that uses self-reported consanguinity as its exposure variable is measuring something different from one that uses FROH. Say which you are using, justify it, and — where both are available — report the correlation between them. That comparison is itself a publishable finding in a population where endogamy is longstanding.
Hypothesis to label as such: that FROH captures recessive-risk-relevant autozygosity in Emiratis better than self-reported relationships do. It is testable in any dataset holding both, and it should be framed as a hypothesis, not an assumption.
3. What runs of homozygosity are and how they are called
A run of homozygosity is a contiguous stretch of the genome where an individual carries identical haplotypes on both chromosomes. Long ROH arise when the two copies descend from a recent common ancestor, because recombination has had few generations to break them up. The general framework, including length-class interpretation, is set out in the standard review of the field [7].
The ROH analysis pipeline. The figure below sets out the seven stages and, critically, the decision each one forces. Name this pipeline as the study’s conceptual framework in the proposal: every later claim depends on these choices being fixed in advance and reported in full.
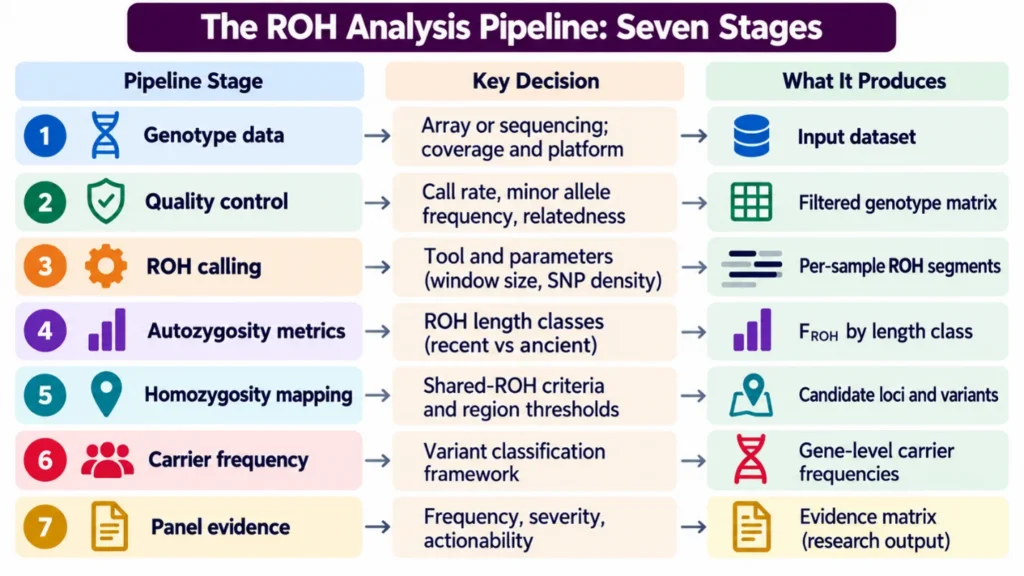
The ROH analysis pipeline: seven stages from genotype data through quality control, ROH calling, autozygosity metrics, homozygosity mapping and carrier frequency estimation to panel evidence, with the decision to prespecify and the output at each stage
Calling approaches to name and justify:
| Approach | How it works | Strengths | Limitations to state |
|---|---|---|---|
| Sliding-window (PLINK –homozyg) [11] | Scans fixed-size SNP windows and calls ROH where a threshold proportion of windows are homozygous | Widely used, well documented, results comparable with much of the literature | Sensitive to window and density settings; performance depends on marker density |
| Model-based hidden Markov (bcftools/RoH) [12] | Models homozygous versus heterozygous states along the genome, using allele frequencies | Handles genotype error probabilistically; suits sequencing data | Needs an appropriate allele-frequency reference, which is itself a population-specific choice |
| Likelihood-based classification (GARLIC) [13] | Classifies ROH into length classes using a likelihood framework with LD-aware windows | Explicit length-class assignment; designed for cross-population comparability | Less commonly used, so fewer directly comparable published results |
Array versus sequencing. Array data give even marker spacing and are well suited to sliding-window calling, but density limits the detection of short ROH. Sequencing data give far denser coverage but require careful handling of variable depth and genotype quality, since apparent homozygosity can arise from low coverage rather than from shared ancestry. State which you have, and what that platform can and cannot resolve.
4. Parameter choices that change ROH results — and how to justify them
This section is where a methods chapter earns its credibility. ROH results are not parameter-free observations; they are the output of a specified procedure.
| Parameter | What it controls | Effect if set too permissively | Effect if set too stringently |
|---|---|---|---|
| Minimum ROH length | The shortest segment counted | Short LD-driven homozygous tracts inflate FROH | Genuine recent autozygosity is missed |
| Window size (SNPs or kb) | The scanning unit | Fragmented calls; boundary imprecision | Smoothing over real segment breaks |
| Minimum SNP count and density | How much evidence a call requires | Calls in sparsely covered regions | Systematic loss in low-density regions |
| Heterozygote allowance per window | Tolerance for genotyping error | Merges distinct segments across true heterozygosity | Genuine long ROH split by single errors |
| Missing-call allowance | Tolerance for missingness | Calls driven by missing data | Loss of segments in imperfect samples |
| LD pruning | Whether correlated markers are thinned | Retained LD inflates short-ROH counts | Pruning can remove the signal long-ROH detection depends on |
How to justify choices, in four steps a supervisor will accept:
- Anchor to precedent. State which published parameter set you are following and in which population it was used, so your results are comparable to something.
- Match parameters to platform. Density thresholds appropriate for a dense sequencing dataset are not appropriate for a sparser array, and vice versa.
- Run a sensitivity analysis. Report FROH under at least two or three plausible parameter sets, and show whether your substantive conclusions change. In our experience reviewing genomics proposals, this single addition converts a contestable methods chapter into a defensible one.
Prespecify. Fix the primary parameter set in the protocol before analysis; report the others as sensitivity analyses rather than selecting the set that produces the most striking result.
5. FROH and ROH length classes: reading recent and ancient inbreeding
FROH is the ratio of total ROH length to the length of the autosomal genome considered. Its apparent simplicity hides a reporting trap: the denominator is a choice. Studies differ in whether they use the full autosomal length, the mappable or callable genome, or the span actually covered by the genotyping platform. Two studies reporting “FROH” may therefore not be comparable. State your denominator explicitly, and when comparing with published values, check theirs.
Length classes carry the temporal signal [7]. Short segments reflect ancient, population-level background relatedness accumulated over many generations, sustained by longstanding endogamy. Long segments reflect recent parental relatedness, because recombination has had few generations to break them. Medium segments sit between the two.
Why this matters for panel design — and it is the analytic heart of the project. The two signals imply different screening consequences. Background autozygosity from ancient endogamy tends to raise homozygosity risk broadly across a community, in ways a population-level panel can address. Recent parental relatedness concentrates risk within specific families and may raise rare, family-specific variants that no fixed panel will capture. A thesis that reports only a single pooled FROH cannot separate these, and therefore cannot say which screening strategy its own data support.
Report, at minimum: the FROH distribution rather than the mean alone; FROH by length class; segment counts alongside total length; and the denominator and parameter set used to derive all of them.
7. Estimating carrier frequencies and classifying pathogenic variants
Carrier frequency is one of the key quantities relevant to panel evaluation, and estimating it well is mostly a classification problem.
The classification step governs everything downstream. Variants should be classified using an established clinical framework such as the ACMG/AMP criteria [8]. The decisive design question is what you count as a carrier: pathogenic variants only, or pathogenic plus likely pathogenic, and how variants of uncertain significance are handled. Each choice produces a different carrier frequency from the same data. Prespecify the rule, and report frequencies under the alternative rule as a sensitivity analysis.
Population-specific variant interpretation is therefore an important methodological issue. With 235 Emirati variants absent from major international databases and 307 classified differently between CTGA and ClinVar [5], classification decisions taken against international references alone may systematically misestimate Emirati carrier frequencies. Document your reference sources and their versions with access dates.
Statistical reporting. Report gene-level carrier frequencies with confidence intervals, prespecifying the interval method — Wilson or Clopper–Pearson rather than the normal approximation, which performs poorly for the rare frequencies that matter most here [9]. Size the study for the precision needed at your lowest decision-relevant frequency, not at the commonest.
Founder variants deserve separate treatment. The Qatari analysis identified 59 potential founder alleles with elevated frequency in subpopulations [6]. Founder variants can reach locally high frequencies while remaining invisible in pooled national estimates, which makes them relevant to evaluating panel composition — and to Section 9’s substructure analysis.
8. Which genes belong on an expanded premarital panel? Building selection criteria
This is where the thesis can move from population description toward evidence relevant to panel evaluation.
The existing international benchmark, and why it does not settle the question. The ACMG practice resource defines carrier screening tiers by carrier frequency, recommending Tier 3 — conditions with a carrier frequency of 1/200 or greater — for all pregnant patients and those planning pregnancy, with Tier 4 (below 1/200) considered for consanguineous relationships or where personal or family history warrants it [10]. Two features make this a research opening rather than an answer. First, the thresholds were derived largely from populations in which consanguinity is uncommon. Second, ACMG itself flags consanguinity as the situation in which the standard tier is insufficient — without specifying what should replace it. The ACMG resource is a United States practice framework, so its components do not all transfer equally: the tier logic and the selection criteria it applies are reusable, whereas the 1/200 cut-off and the gene lists behind it would need validation against Emirati carrier frequencies [14] before being treated as locally applicable.
The design question, stated for a proposal: what carrier-frequency threshold, applied to Emirati population genomic data, produces an expanded carrier screening panel that is defensible on detection, cost, counselling burden and equity — and how does that threshold compare with 1/200?
Five criteria a defensible gene-selection framework must operationalise:
| Criterion | What it means | How to operationalise it | Where judgement enters |
|---|---|---|---|
| Carrier frequency | How common the carrier state is in the target population | Gene-level estimates with confidence intervals from local data | Choosing the threshold, and whether it is national or substructure-specific |
| Severity | The clinical impact of the condition | A published severity classification applied by more than one rater, with agreement reported | Severity scales embed value judgements; state which scale and why |
| Penetrance and expressivity | Whether and how consistently carriers of two variants are affected | Evidence from the literature and local clinical cohorts | Penetrance is often poorly characterised for rare conditions |
| Actionability | Whether identification changes anything — reproductive options, surveillance, early treatment | Explicit categories, prespecified | What counts as actionable is context- and values-dependent |
| Test performance | Detection rate, residual risk, and whether variants are detectable by the assay | Analytical validity for the specific variant classes in the population | Assay limits differ for structural, repeat and deep-intronic variants |
Counselling burden as a sixth dimension. Expanding the number of genes screened increases the volume of carrier findings and may also increase the number of results requiring additional interpretation, depending on variant spectrum, assay design and classification uncertainty. A panel optimised on detection alone can exceed what a counselling service can deliver, which is a real constraint on implementation and belongs in the analysis — not in the discussion as an afterthought.
9. Regional and tribal substructure: why national averages can mislead
A single national carrier frequency is an average over a structured population, and averaging is exactly what can hide the cases a panel exists to catch.
The evidence that substructure matters here. Emirati autozygosity is not uniform: ROH burden was largest in groups with Arabian main ancestry within the national cohort [3]. Regionally, Peninsular Arabs showed 5.8-fold enrichment for homozygous pathogenic variants relative to other ancestry groups in the Qatari analysis [6]. For example, a hypothetical variant observed at 1/300 nationally could have a substantially higher frequency in one community and be absent or very rare elsewhere.
How to handle it analytically:
- Define strata genomically, not only administratively. Use genetic principal components or clustering to define ancestry groups, and report how these relate to reported region or lineage — rather than assuming the two coincide.
- Report stratum-specific frequencies with intervals. Expect wide intervals in small strata and say so; precision, not point estimates, determines what can be concluded.
- Prespecify the decision rule. State in advance whether a gene qualifies on national frequency, on any stratum exceeding the threshold, or on a weighted rule — and justify the choice.
- Handle stratum identification carefully. Reporting that a named tribe or region carries elevated risk has consequences beyond the thesis. Section 10 covers the governance of this directly; the analytic point is that the reporting granularity should be decided with the ethics committee before analysis, not after.
The genuine trade-off to discuss. A single national panel is simpler, cheaper and equitable in access, but may under-serve high-burden subgroups. A stratified panel may detect more but raises questions of how strata are assigned, whether assignment is acceptable to communities, and what happens to people of mixed or unassigned background. A thesis that presents the evidence for both, rather than advocating one, is stronger.
10. Ethics, stigma and consent in consanguinity research
This is a topic where the ethics section is substantive methodology, not paperwork.
Governance requirements. Federal Decree-Law No. 49 of 2023 governs all human-genome use in the UAE, including free zones (Art. 2), and came into force on 1 December 2023 (Art. 48) [2]. The provisions below bear directly on this design. This is a research-planning summary, not legal advice.
| Provision | Article [2] | Implication for this PhD |
|---|---|---|
| Written, explicit informed consent on the Health Authority’s approved form | Art. 6 | Consent must cover genomic analysis and any linkage to clinical or screening records |
| New consent required to use samples for additional purposes | Art. 7(7) | Secondary use of stored premarital-screening samples may require re-consent |
| Samples may not be transferred or stored outside the UAE except as the Health Authority determines or approves | Art. 7(9) | Plan sample handling and any external sequencing accordingly |
| Right to withdraw from voluntary genomic or genetic screening | Art. 8 | Withdrawal has to be operationalised in the protocol: how a participant withdraws, and what happens to data and samples already generated |
| Right to request results, with genetic counselling provided once results are issued | Art. 9 | A return-of-results pathway and a referral route to qualified genetic counselling must be specified before data collection, not improvised afterwards |
| Genome research must meet the legislation governing scientific and clinical research | Art. 18 | Research-planning implication: in practice both institutional and regulator approvals are required |
| Genomic data kept confidential; no use leading to discrimination | Art. 25(1)–(2) | Directly relevant to reporting by tribe or region; aggregate reporting only |
| Research containing UAE Genome Programme data may be published only with approval of the Minister or Head of the Health Authority | Art. 25(3) | Build publication approval into the timeline if national data are used |
| Obligatory premarital genomic screening; list of diseases set by ministerial resolution | Art. 15 | The panel is set by resolution, so panel evidence has a defined route to influence |
| National Genomic Database; licensing of facilities providing genome services | Arts 26, 28 | Work through licensed, authorised custodians |
Four design obligations specific to this topic:
- Frame consanguinity as a variable, not a verdict. Write the protocol, the consent materials and the thesis in language that describes autozygosity and its genomic consequences without characterising a social practice as a failing. This is not only ethical positioning: stigmatising framing is a common reason sensitive-topic protocols are returned for revision.
- Decide the reporting granularity in advance. Agree with the ethics committee, before analysis, whether findings will be reported by named tribe or region, by anonymised genomic cluster, or at national level only. Group-level findings can affect people who never consented individually.
- Plan for incidental and actionable findings. Analysing genomes for carrier status will generate findings relevant to participants and their relatives. Decide what is returned, through what clinical pathway, with what counselling, and record it in the consent form. For a study involving reproductive-risk information, the return-of-results pathway should be explicitly addressed.
- Involve the counselling service early. A panel recommendation with no assessment of counselling capacity is incomplete evidence. Genetic counsellors are also the people best placed to advise on consent language.
The boundary this thesis must hold. The research produces population-level evidence about panel composition. It does not advise any individual or couple, does not evaluate anyone’s marriage choices, and does not substitute for genetic counselling. State that boundary in the thesis, and hold to it in any dissemination.
11. PhD Assistance Carrier-Panel Gene Prioritisation Framework
The framework assesses candidate genes against the five selection criteria plus counselling burden. Its primary output is a multi-criteria evidence matrix, not a single composite score: any weighting applied across criteria is itself a value judgement that would need separate justification. A composite score may be reported as a secondary, clearly labelled analysis.
| Dimension | Evidence source | Suggested scoring approach | Prespecify in the protocol |
|---|---|---|---|
| Carrier frequency in target population | Local population genomic data; stratum-specific estimates | Banded against the chosen threshold, with the confidence interval carried through | The threshold; whether national or stratum-specific qualification applies |
| Severity | Published severity classification, applied by independent raters | Ordered categories, with inter-rater agreement reported | Which classification scale; how disagreements are resolved |
| Penetrance and expressivity | Literature and local clinical cohorts | High / moderate / uncertain, with the evidence basis recorded | How “uncertain” genes are treated at the decision stage |
| Actionability | Prespecified categories covering reproductive options, surveillance and treatment | Ordered categories | The category definitions, fixed before scoring |
| Test performance | Assay validation data for the relevant variant classes | Detectable / partially detectable / not reliably detectable | How residual risk is reported per gene |
| Counselling burden | Expected carrier and uncertain-result volume from the frequency data | Modelled results per 1,000 screened | Whether burden acts as a weight or as a reported consequence |
Worked operationalisation. The dimensions become usable only once the bands are written down before scoring any gene. One workable set, offered as a starting point to adapt rather than a validated instrument: carrier frequency scored 0–4 against the chosen threshold, from 0 below half the threshold to 4 at four times it; severity 0–3 on the chosen published classification; penetrance 0–3, with genes whose penetrance is uncertain scored 0 rather than dropped; actionability 0–3 on the prespecified categories; and test performance 0–3 on detectability for the relevant variant classes. Counselling burden is reported alongside the matrix rather than scored into it, because it is a consequence of the resulting list rather than a property of any single gene. Four rules need fixing in the protocol in advance: how missing evidence is handled — a prespecified default score with the gap recorded, rather than exclusion, which silently favours well-studied genes; how ties are broken, for example by carrier frequency with its confidence interval and then by severity; what inclusion threshold applies if a composite score is used at all; and how the result moves under at least two alternative weightings.
Keep the matrix primary, the score secondary. The defensible primary output is the full scored matrix, with every dimension visible per gene and every missing or uncertain entry flagged. A composite score is a secondary summary — useful for communication and for sensitivity analysis — and it should not be the only thing reported, because collapsing five dimensions into one number conceals exactly the judgement calls an examiner will want to inspect.
How to use it. Score every candidate gene on all six dimensions, report the full scored matrix as a thesis appendix, then present any ranked list under your prespecified threshold alongside at least one alternative threshold. Presenting the ranking’s sensitivity to the threshold is more defensible than presenting a single list, and it is more useful to anyone making the actual decision.
What the framework is not. It is a research instrument for generating and structuring evidence. It does not constitute a recommended panel, and health authorities that set the list by resolution [2] decide any changes to a national screening programme.
12. How to turn this blueprint into an approvable PhD proposal
A PhD research proposal on this topic must state the research questions, one primary aim with a measurable endpoint, the evidence gap, the expected limitations and the contribution, and pair every data dependency with a documented fallback.
Evidence gap map
| Existing evidence | Population and data | Main contribution | Remaining gap |
|---|---|---|---|
| Mousa et al. 2025 [3] | 43,608 Emirati genomes | Population-scale autozygosity: inbreeding coefficients, ROH length, consanguineous family reconstruction | Autozygosity characterised, but not linked to gene-level carrier frequencies or panel evidence |
| Bizzari et al. 2023 [5] | CTGA records for Emiratis | 665 conditions, 1,365 variants; 235 absent from international databases | A catalogue of reported variants, not population carrier frequencies |
| Jain et al. 2025 [14] | 1,194 Emirati exomes; 1,333 Arab Emirati families | Gene-level carrier rates (CYP21A2 10.6%, HBB 9.6%, MEFV 5.9%, ABCA4 4.3%); at-risk couple rates of 4–21% depending on the panel assumed; a provisional 481-gene list, of which 214 of 425 additional genes (50%) are absent from the 570-gene MoHAP panel | Carrier frequencies published without linkage to autozygosity, substructure stratification or threshold sensitivity analysis |
| Alblooshi et al. 2026 [15] | 1,000 Dubai couples screened on 782 genes | 79 at-risk couples (8%, 95% CI 6.4–9.7); 18% of at-risk couples detected only through locally sourced genes; consanguinity or shared ancestry in 28.0% of sequenced couples | Implementation outcomes for one city panel; the gene-selection evidence and the threshold logic behind panel composition remain separate questions |
| Aamer et al. 2024 [6] | 6,045 Qatari whole genomes | 62.5% carriers; 1 in 150 homozygous; 56 genes above 1/50 carrier frequency; 59 founder alleles | Qatari, not Emirati; demonstrates the method is achievable regionally |
| MoHAP 2025 policy [1]; Decree-Law 49/2023 Art. 15 [2] | National programme | A 570-gene mandatory panel, revisable by ministerial resolution | The published evidential basis for gene inclusion and thresholds is not established in the public literature |
| ACMG practice resource [10] | International | Tiered thresholds; Tier 3 at 1/200 | Thresholds derived largely from non-consanguineous populations; Tier 4 flagged but unspecified for consanguinity |
Novelty matrix
| Component | What is already known | What remains unknown | What this PhD would add |
|---|---|---|---|
| Autozygosity | Elevated ROH and inbreeding coefficients in Emiratis, varying by ancestry group [3] | FROH by length class linked to carrier burden; relationship between reported consanguinity and measured autozygosity | A length-class-resolved autozygosity profile tied to recessive-risk outcomes |
| Carrier burden | Emirati gene-level carrier rates and a provisional 481-gene list [14]; regional estimates from Qatar [6]; an Emirati variant catalogue [5] | Whether those estimates hold under interval estimation, a stated classification rule and stratification by genomic substructure | Carrier frequencies regenerated under a documented classification rule, with confidence intervals and stratum-level estimates |
| Panel evidence | A 570-gene national panel [1]; a 782-gene Dubai implementation panel evaluated in 1,000 couples [15]; international tiers [10] | Which threshold is defensible for a population with this autozygosity profile, and how sensitive panel composition is to it | A criteria-scored evidence matrix with threshold sensitivity analysis, any ranking reported as a secondary view |
| Substructure | Ancestry-group differences reported [3, 6]; consanguinity or shared ancestry met the programme threshold in 28.0% of sequenced Dubai couples [15] | Whether national frequencies mask stratum-level qualifying genes | Stratum-specific frequencies and a prespecified qualification rule |
Research questions to adapt:
- RQ1: What is the distribution of FROH in the study population, by ROH length class, under a prespecified calling parameter set?
- RQ2: How does measured autozygosity relate to reported parental consanguinity, where both are available?
- RQ3 (primary): What are the gene-level carrier frequencies for recessive conditions in this population, with confidence intervals, under a prespecified variant-classification rule?
- RQ4: Applying prespecified selection criteria, which genes qualify for an expanded panel, and how sensitive is that list to the carrier-frequency threshold?
- RQ5 (exploratory): Do genomic strata show carrier frequencies that differ materially from the national estimate, and would any gene qualify on stratum-specific but not national frequency?
Expected limitations to state in the proposal:
- Sampling frame limits generalisation; a clinical or screening-derived sample is not a population sample.
- ROH calls depend on platform and parameters; sensitivity analyses mitigate but do not remove this.
- Carrier frequencies depend on the classification rule, and variants of uncertain significance are a substantial category in an understudied population [5].
- Severity and actionability scoring embeds value judgements, however transparently applied.
- Homozygosity mapping localises regions but does not establish causation without confirmation.
- Small genomic strata yield imprecise estimates.
- Access, consent scope and publication approvals may restrict which outputs can be released [2].
- Panel evidence is not a panel decision, and no implementation outcome can be evaluated within a doctoral timeline.
Contribution statement. A finished thesis based on this design will provide (1) an autozygosity profile by length class for the study population with a reproducible ROH analysis pipeline; (2) gene-level carrier frequency estimates with confidence intervals for a pre-specified classification rule; (3) a criteria-scored evidence matrix covering every candidate gene, with any ranked list reported as a secondary, threshold-dependent view rather than as a panel recommendation; and (4) a prioritisation framework which can be exported to other Gulf population genetics research.
Design weaknesses that get genetics proposals sent back: novelty asserted rather than demonstrated against current policy and literature; consanguinity and autozygosity used interchangeably; ROH parameters unstated or unjustified; no sensitivity analysis; carrier frequencies reported without a classification rule or confidence intervals; national averages presented with no substructure analysis; reporting granularity for tribal or regional findings not agreed with the ethics committee in advance; no return-of-results pathway; and panel recommendations framed as policy rather than as evidence.
Frequently asked questions
How can an ROH-based PhD remain novel when Emirati carrier-frequency studies already exist?
Emirati gene-level carrier frequencies have already been published [14], and a 782-gene Dubai panel has been evaluated in 1,000 couples [15]. Novelty therefore has to come from integration: linking ROH and FROH patterns, length classes and genomic substructure to carrier burden within a prespecified, reproducible panel-evaluation framework. Confirm that this combination remains unpublished through a documented systematic search.
Is ROH analysis alone enough for a PhD?
Rarely. Autozygosity has already been characterised at population scale in Emiratis [3]. ROH analysis works as the foundation, but the doctoral contribution usually comes from linking it to gene-level carrier frequencies and to a transparent, criteria-based panel evidence framework.
Which of the three areas makes the best primary aim?
Which parameters should I use for ROH calling?
Should I use FROH or reported consanguinity as my exposure?
They measure different things, so the answer depends on the question. FROH measures realised autozygosity; reported relationship measures a social variable with an expected inbreeding coefficient attached. Where both are available, reporting their relationship is itself a finding worth publishing in an endogamous population.
How do I decide the carrier-frequency threshold?
Treat it as a research question rather than a given. The ACMG tiers place Tier 3 at 1/200 [10], but those thresholds come largely from populations where consanguinity is uncommon. Report your ranked gene list at your prespecified threshold and at plausible alternatives, so the decision’s sensitivity is visible.
How do I handle tribal or regional findings responsibly?
Agree the reporting granularity with your ethics committee before analysis, not after seeing results. Options include named groups, anonymised genomic clusters or national-level reporting only. Group-level findings affect people who never individually consented, and the non-discrimination provision applies directly [2].
Can my thesis recommend changes to the national screening panel?
No. It can produce ranked, criteria-scored evidence and discuss what that evidence would imply. Decisions on the national panel are made by ministerial resolution [2] and rest with health authorities, informed by counselling capacity, cost and implementation considerations beyond a doctoral study.
What if I cannot access national genomic data?
Name a fallback in the proposal. Options include a clinical exome or diagnostic cohort with its narrower sampling claim stated, a systematic review and meta-analysis of published regional autozygosity and carrier data, or a methodological study comparing ROH calling approaches on available data. Each is publishable and each de-risks the primary study.
Request a genetic-epidemiology topic feasibility and proposal review
Request a genetic-epidemiology topic feasibility and proposal review — PhD Assistance’s research-methodology team reviews your topic against this blueprint. You receive:
- Novelty assessment: your question mapped against current UAE screening policy, national genomic work and the regional literature
- Exposure-definition check: autozygosity versus reported consanguinity, and which your data and question support
- ROH pipeline review: calling tool, parameter set, justification strategy and sensitivity analysis plan
- Carrier-frequency analysis plan: classification rule, uncertain-variant handling, interval method and precision calculation
- Panel-evidence framework: criteria operationalisation, scoring plan and threshold sensitivity design
- Ethics and governance map: approvals, consent scope, reporting granularity and return-of-results pathway
- Fallback design: a documented lower-risk alternative if data access is delayed
To start, share: your draft topic or research questions, your target university and programme, and what you currently know about data access and ethics approval. The review supports your own proposal writing; it does not replace it, and it does not provide clinical, counselling or reproductive guidance.
Related support: research proposal development · bioinformatics and biostatistics analysis · systematic literature review