
Dust Soiling Loss Modelling and Robotic Cleaning Schedule Optimisation for Utility-Scale PV Plants in UAE Desert Conditions
Unsupervised Domain Adaptation
- Why this is a research problem, not an O&M decision
- What the Gulf evidence actually establishes
- The measurement layer: define before you model
- Modelling accumulation: the rain-reset assumption fails here
- Cementation: delay changes recoverability, not just loss
- Abrasion: the cost most schedule models omit
- Formulating the optimisation
- From deterministic to stochastic
- Instrumentation and data: the binding constraint
- Validation, and the limits of the claim
- Study design checklist
- Research questions, contribution, and what a reviewer will ask

Recent Post
The textbook version of this problem is a two-term trade-off: energy lost to dust against the cost of cleaning it off, with an optimum somewhere in between. The Gulf evidence says that model is incomplete in two specific ways — and both of them move the answer. This PV soiling research design framework focuses on how UAE utility-scale data can be used to estimate soiling accumulation, cleaning recovery and robotic cleaning-related degradation.
Who is this for: PhD scholars in energy engineering, renewable energy systems, operations research and asset management; and supervisors scoping empirical PV performance projects in the UAE and GCC.
Scope. This article separates published evidence, cited to source, from research hypotheses, labelled as such, and design guidance. It is research-methodology guidance only. It is not an operating recommendation, a safety assessment, a cleaning schedule for any plant, or an evaluation of any robot, coating or module product. Operators should rely on their own testing, manufacturer guidance and warranty terms.
1. Why this is a research problem, not an O&M decision
Choosing a cleaning interval is an operational decision. Establishing what the objective function should contain is a research question, and it is not settled.
The standard formulation balances revenue lost to soiling against the cost of cleaning, and derives an optimal interval by setting the derivative of total cost to zero. A published framework applying exactly this logic to a large-scale plant in Senegal found an optimal cycle of 14 days against an incumbent practice of eight cleans a year, and estimated a 31% reduction in soiling-attributable cost [1]. The method is sound and the arithmetic is reproducible. The question a UAE thesis has to answer first is whether the two terms are the only ones that belong in it.
2. What the Gulf evidence actually establishes
A decade of field soiling assessment at a Gulf outdoor test facility has established soiling as a first-order performance and reliability problem in arid regions, and frames the central operational tension as balancing cleaning frequency against operation and maintenance cost [9]. Three further findings change the structure of that problem rather than just its parameters.
Dust cements to glass. In Qatar’s climate, dew forms frequently and leads to particle cementation by needle-shaped crystals of the clay mineral palygorskite; preventing dew formation by heating samples inhibits cementation and significantly reduces dust accumulation [2]. Cemented soiling is not equivalent to loose dust, and a dry clean does not remove it the same way.
Cleaning abrades the surface, and the dust does the abrading. A review of coating abrasion by cleaning machines in desert environments reports that anti-reflective coatings vary widely in susceptibility, that uncoated glass is essentially resistant to dry brushing, and — importantly for modelling — that the soiling layer itself drives much of the abrasion during brushing [3]. The damage term is therefore coupled to the soiling term, not independent of it.
The abrasion rate is specific to the robot–module pair. An 18-month field study in Qatar tested nine module types under daily cleaning, weekly cleaning and no cleaning. Five module types showed greater losses with more frequent cleaning; the other four did not. The authors recommend testing specific robot/module pairs in the field rather than relying on laboratory results [4]. A parameter that behaves that way cannot be taken from the literature and inserted into a model.
3. The measurement layer: define before you model
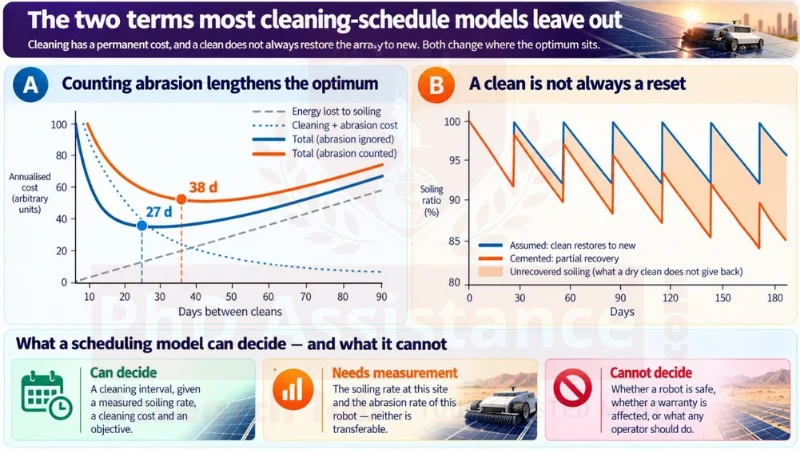
Figure 1. The two terms most cleaning-schedule models leave out. Panel A shows how counting a per-clean abrasion cost lengthens the optimal cleaning interval; Panel B shows why the recovery fraction after a clean is a parameter to be measured. The figure is illustrative and contains no empirical UAE plant data.
Before any model, the quantity being modelled needs a definition a reviewer will accept. IEC 61724-1:2021, Edition 2.0 — Photovoltaic system performance, Part 1: Monitoring — specifies terminology, equipment and methods for PV performance monitoring, defines monitoring system classes, and in this edition updated the requirements for soiling measurement [5]. A thesis that reports a “soiling loss” without stating which measurement class, which reference device and which averaging convention produced it has not yet defined its dependent variable.
State the configuration, not just the standard. As a worked example of what that commitment looks like: a soiled/clean reference-device pair mounted in the array plane at module tilt, with the clean device washed on a fixed daily schedule and the soiled device left unwashed between plant cleans; a stated IEC 61724-1 monitoring class; the soiling ratio computed from short-circuit current at matched irradiance and temperature, filtered to a defined irradiance window around solar noon and aggregated to a daily value; and a timestamped cleaning log for both devices and the array. This configuration is illustrative — the point is that a proposal should name one, with its filtering and aggregation rules, before any modelling begins.
4. Modelling accumulation: the rain-reset assumption fails here
A widely used empirical soiling model assumes linear accumulation at a constant daily rate, with rainfall above a threshold resetting soiling to zero and a grace period afterwards [6]. The original work was calibrated on Californian and southwestern US sites, where the model’s key feature — rain as a free, recurring cleaning event — is doing real work.
In many UAE desert settings, rainfall-reset events may be infrequent relative to dry-period accumulation, which has a specific consequence rather than a vague one: where that holds, the model’s reset term rarely fires, and most of the behaviour is carried by the accumulation rate and by scheduled cleaning. How often it holds is itself site- and season-specific, and should be established from local rainfall records rather than assumed. This is a hypothesis for a thesis to test, not a finding: that a rain-reset soiling model fitted to UAE data degenerates towards a linear accumulation model punctuated only by interventions, and that its predictive value therefore depends almost entirely on how well the daily rate is estimated and how the recovery after each clean is specified.
5. Cementation: delay changes recoverability, not just loss
Standard scheduling treats delay as costing energy. Cementation means delay may also cost recoverability — the longer a cemented layer is left under repeated dew cycles, the less of the original transmission a dry clean returns [2].
Panel B of the figure draws the consequence. If each clean restores the array to its original state, the soiling ratio is a sawtooth with a flat ceiling. If recovery is partial, the ceiling falls with every cycle, and the gap between the two is energy no dry clean gives back. The recovery fraction is therefore a parameter to be estimated, not set to one for convenience, and a thesis that assumes full recovery has assumed away one of the two things that makes this problem regionally distinctive.
6. Abrasion: the cost most schedule models omit
The second missing term is permanent. Repeated cleaning abrades the module’s first surface, and the loss does not come back. Artificial linear brush abrasion testing of PV module first-surface coatings — silane-functionalised, etched, porous-silica, fluoropolymer and ceramic — has characterised how these coatings fail and compared slurry against dry-dust abrasion, work aimed at developing industry standards for assessing surface durability during maintenance [7]. How the damage is measured matters too: a study of abrasion tests on antireflective and antisoiling coatings concluded that solar transmittance alone is not sufficient to characterise abrasion degradation, and that haze and absorptance should be measured alongside it, with locally sourced sand rather than a standardised abrasive [10]. In practice that means measuring on three levels at once:
- Optical — transmittance, plus haze and absorptance, because transmittance alone misses the damage mode [10];
- Electrical — maximum power under matched conditions, so the optical change is tied to yield;
- Surface — microscopy or reflectometry, with reflectivity a practical field metric that tracks module optical performance [3].
Reporting only one of the three is how an abrasion result becomes unfalsifiable.
Two features make this hard to model and interesting to research. First, the coupling: the soiling layer supplies much of the abrasive during brushing [3]. This evidence supports testing whether abrasion severity varies with the soiling state at the time of cleaning — a modelling hypothesis, not an established universal. If it holds, the two decision terms are not separable, and treating them as independent is a specification error rather than a simplification. Second, the heterogeneity: with five of nine module types showing greater losses under more frequent cleaning and four showing none [4], there is no transferable abrasion coefficient.
Where this lands in the optimisation. Adding a per-clean cost that is permanent rather than recurring pushes the optimum towards longer intervals. Panel A shows the shape: on an illustrative objective, adding a per-clean abrasion cost equal to the cleaning cost moves the optimum from 27 to 38 days. The numbers are arbitrary; the direction is not.
7. Formulating the optimisation
Specify each layer of the model explicitly. A term that is theorised but not measured, or measured but not identified, is where this kind of thesis comes apart at examination.
Model layer | What must be specified |
Objective | What is being minimised — cost, LCOE, lost yield, or a multi-objective trade-off including water |
Decision variable | Fixed interval, state-triggered threshold, or a per-sector schedule |
Soiling model | Functional form, daily rate, and whether the rate is seasonal |
Recovery model | The fraction of performance a clean returns, and whether it declines with cycles |
Damage model | Per-clean permanent loss, and its dependence on soiling level at the time of cleaning |
Constraints | Robot throughput, water availability, access windows, labour, irradiance curtailment |
Data source | On-site soiling station, reference cells, string-level inverter data, drone or EL inspection |
Validation | Hold-out period, or a controlled comparison against the incumbent schedule |
Write the objective and its units down before differentiating anything. Under a simplified linear-soiling model a closed form exists, but only once the economic objective and the units are defined consistently. Define:
Symbol | Meaning | Units |
T | interval between cleans — the decision variable | d |
r | daily soiling loss, as a fraction of clean-condition output lost per day | d⁻¹ |
E | expected clean-condition energy yield | kWh·d⁻¹ |
p | value of energy (tariff or PPA price) | currency·kWh⁻¹ |
C | fixed cost of one cleaning event | currency·event⁻¹ |
A | present value of the permanent revenue loss caused by one cleaning event, discounted over the remaining plant life | currency·event⁻¹ |
With soiling accumulating linearly and reset at each clean, mean fractional loss over a cycle is rT/2, so annual cost is J(T) = 365·[pEr T/2 + (C + A)/T]. Setting the derivative to zero gives
T* = √( 2(C + A) / (p·E·r) )
and the 365 cancels, so it does not belong in the expression. Units check: C + A is in currency; pEr is currency·d⁻²; the ratio is d², and the root is in days.
Why abrasion enters as A and not as an operating cost. Abrasion causes a permanent transmission loss, so its cost is the discounted stream of all future energy that loss forgoes, not a one-off expense in the year the cleaning happened. Converting it to a present value per cleaning event is what makes it commensurate with C. A thesis that instead models cumulative degradation explicitly — carrying a state variable for accumulated transmission loss — is doing the same thing more honestly and should say so.
A worked example, illustrative throughout. Choose C and pEr so that the optimum with no abrasion term lands at 27 days. Now set A = C: the optimum moves to 38 days. These figures are arithmetic on invented inputs, included to show that the abrasion term changes the answer rather than decorating it. The closed form is a benchmark for intuition only; a site-level thesis should use measured energy yield, the actual value of energy, recorded cleaning costs and explicit degradation assumptions rather than this reduced expression.
What each parameter costs you if you assume it. The table below is the measurement plan in compressed form, and it is the part a supervisor should sign off before fieldwork starts.
Parameter | Measurement | Model role | If assumed incorrectly |
Soiling rate | Soiling station or reference devices [5] | Accumulation | Cleaning interval biased |
Recovery fraction | Pre- and post-clean performance [2] | Reset and recovery | Energy recovery overstated |
Abrasion rate | Pmax plus optical and surface characterisation [4,10] | Permanent degradation | Long-term cost understated |
Soiling level at cleaning | Timestamped soiling ratio and cleaning log [3] | Coupling term | Abrasion assumed independent of soiling |
Cleaning cost | Actual O&M records | Economic objective | Optimum interval distorted |
Value of energy | Plant revenue or tariff model | Lost-energy cost | Financial optimum distorted |
Robot availability | Event logs | Operational constraint | Schedule infeasible |
8. From deterministic to stochastic
A fixed interval is the easiest thing to optimise and the least defensible. Soiling rates vary with season, wind, dust events and dew frequency; energy prices and curtailment vary; robot availability varies. Three extensions are each a thesis-sized contribution: a state-triggered policy that cleans when the estimated soiling ratio crosses a threshold rather than when a calendar says so; a stochastic formulation that treats the soiling rate as a random process and optimises expected cost under uncertainty; and a forecast-driven policy that uses dust and weather forecasts to defer a clean ahead of a predicted dust event. Each needs its own validation design, and a thesis should pick one rather than gesture at all three.
9. Instrumentation and data: the binding constraint
This is the feasibility gate, settled before the proposal is written. A credible study needs a soiling measurement conforming to a stated IEC 61724-1 class [5], a cleaning log with per-event timestamps, and enough plant-side resolution to attribute losses to soiling rather than to temperature, shading, degradation or inverter clipping.
Access to utility-scale UAE plant data is a major feasibility risk for this proposed design, and no established research-access route was identified in the sources reviewed for it. Work down this order: a collaboration agreement with a plant owner or utility, with a named contact and a written data-sharing agreement; an instrumented test array at a university or research facility, accepting that it is not a utility-scale plant; and a simulation study calibrated on published desert soiling parameters, declared as such from the outset. If none is achievable, the thesis becomes a modelling and methodology contribution — defensible if declared, not if discovered late.
Operational data is commercially sensitive. Settle non-disclosure terms, reporting granularity and publication rights before collection, not at write-up.
10. Validation, and the limits of the claim
A model that fits its own calibration period has demonstrated nothing. Hold out a period, or better, run a controlled comparison in which sectors on the same site are cleaned on different schedules and compared.
And be explicit about what the study does not establish. A scheduling model can recommend an interval given a measured soiling rate, a measured abrasion rate and a stated objective. It cannot establish that a particular robot is safe, that a warranty is unaffected, or what any operator should do. A two-year evaluation of five dry-cleaning robots at a test facility adjacent to the Mohammed bin Rashid Al Maktoum Solar Park reports cleaning efficiencies spanning 69–99%, daily robotic cleaning reducing soiling rates from roughly 0.14–0.33% per day to below 0.02% per day, and no robot-induced cell cracks detected by electroluminescence or dark lock-in thermography, alongside reliability issues including battery overheating, ingress and corrosion problems and UV degradation of polymer components [8]. Read what that does and does not establish. It is the closest published evidence to a UAE utility-scale setting, and the soiling rates are the most directly applicable figures in this article. It is still one test facility, five specific robot models and a defined set of modules; it does not license a claim about any other robot, module or site, and the absence of detected cell cracks in that study is not a safety clearance for robotic cleaning in general.
11. Study design checklist
Dimension | Evidence to hold before submission | Risk if unresolved |
Soiling definition | A stated IEC 61724-1 monitoring class and reference device [5] | The dependent variable is undefined |
Soiling rate | Measured on site, with seasonal variation characterised | A literature rate imported from another desert |
Recovery fraction | Estimated, not assumed to be one [2] | Cementation modelled away |
Abrasion rate | Measured for the specific robot–module pair [4] | A non-transferable parameter transferred |
Coupling | A stated treatment of abrasion’s dependence on soiling level [3] | Two coupled terms modelled as independent |
Objective | Written down before any optimisation is run | The objective fitted to the preferred answer |
Data access | A named plant contact and a signed agreement | The commonest feasibility failure |
Validation | A hold-out period or controlled sector comparison | A model that only fits itself |
12. Research questions, contribution, and what a reviewer will ask
RQ1 (primary): what functional form best describes dust soiling accumulation at a UAE utility-scale site, and how much does the fitted daily rate vary by season? Estimation, not hypothesis testing. RQ2: what fraction of pre-clean performance does a dry robotic clean recover, and does that fraction decline across successive cycles? RQ3: what per-clean permanent transmission loss is attributable to robotic cleaning for a given robot–module pair, and does it depend on the soiling level at the time of cleaning? RQ4: under an objective that includes soiling loss, cleaning cost and permanent abrasion cost, how does the optimal cleaning interval differ from the interval implied by the two-term model? RQ5 (exploratory): does a state-triggered or forecast-driven policy outperform a fixed interval under measured soiling variability?
A completed thesis would deliver a soiling model calibrated and validated on UAE data; estimates of recovery and abrasion parameters rather than assumptions; an optimisation formulation that states its objective and constraints explicitly; and a clear account of which conclusions depend on which measured parameter. Site coverage bounds generalisation, and no conclusion about any commercial robot, coating or module product is supportable from a single-site study.
Common weaknesses that require revision: a soiling rate imported from another country; full recovery after cleaning assumed rather than measured; abrasion omitted because it is inconvenient to quantify; an objective function written after the results; a single site presented as a regional finding; and a product comparison the design cannot support.
Frequently asked questions
For a feasibility estimate, yes, if you say so. Not if the rate is being presented as an empirically estimated UAE site parameter. Soiling rates depend on local dust composition, dew frequency, wind and site layout, and the recovery and abrasion parameters are even less transferable [3,4]. A borrowed rate makes the model’s output a restatement of someone else’s site.
Because it adds a cost that scales with the number of cleans, like the cleaning cost itself, while the soiling loss scales with the interval. Adding to the per-clean side of the balance moves the optimum towards fewer, later cleans. The size of the shift depends on the abrasion rate, which is why measuring it matters.
That is a product and operations question this kind of study cannot settle, and nothing here should be read as a recommendation either way. What a thesis can do is measure the parameters — recovery fraction, abrasion rate, throughput — that any such comparison would need.
A soiling measurement meeting a stated IEC 61724-1 monitoring class, a reference device or soiled/clean pair, a timestamped cleaning log, and enough plant-side data to separate soiling from temperature, shading and degradation effects [5]. Without the cleaning log, the model cannot be identified at all.
Need to validate your PV research design before data collection?
PhD Assistance can review the proposed soiling measurement plan, the parameter-identification strategy, the optimisation objective and the validation design, to identify methodological weaknesses before the study begins — while they are still cheap to fix.
Request a PV Modelling Research Design Review with PhD Assistance’s research-methodology team. You receive a written recommendations summary for a supervisor meeting, covering: whether each model parameter is identifiable from the data you will actually have; whether the objective function and its units are stated defensibly; which measurements must be in place before fieldwork; and how the model will be validated. The consultation advises on methodology; you carry out the research.
Related support: PhD research proposal development · PhD data analysis and statistics · PhD literature review support
Reference
Vancouver style throughout. Each entry carries a DOI where one was verified for this build; standards carry their official publisher URL.
- Diouf MC, Faye M, Thiam A, Sambou V. A framework of optimum cleaning schedule and its financial impact in a large-scale PV solar plant: a case study in Senegal. EPJ Photovolt. 2022;13:21. doi:10.1051/epjpv/2022019
- Ilse KK, Figgis BW, Werner M, Naumann V, Hagendorf C, Pöllmann H, Bagdahn J. Comprehensive analysis of soiling and cementation processes on PV modules in Qatar. Sol Energy Mater Sol Cells. 2018;186:309–323. doi:10.1016/j.solmat.2018.06.051
- Figgis B, Bermudez V. PV coating abrasion by cleaning machines in desert environments — measurement techniques and test conditions. Sol Energy. 2021;225:252–258. doi:10.1016/j.solener.2021.07.039
- Figgis B, Abdallah A, Kivambe M, Samara A, Aissa B, Lopez Garcia J, Bermudez V. Abrasion of PV antireflective coatings by robot cleaning. IEEE J Photovolt. 2024;14(5):824–829. doi:10.1109/JPHOTOV.2024.3414192
- International Electrotechnical Commission. IEC 61724-1:2021, Photovoltaic System Performance — Part 1: Monitoring. Edition 2.0. Geneva: IEC; 21 July 2021. https://webstore.iec.ch/en/publication/65561
- Kimber A, Mitchell L, Nogradi S, Wenger H. The effect of soiling on large grid-connected photovoltaic systems in California and the southwest region of the United States. In: 2006 IEEE 4th World Conference on Photovoltaic Energy Conversion. 2006. doi:10.1109/WCPEC.2006.279690
- Newkirk J, Nayshevsky I, Sinha A, Law A, Xu Q, To B, Ndione P, Schelhas L, Walls J, Lyons A, Miller D. Artificial linear brush abrasion of coatings for photovoltaic module first-surfaces. Sol Energy Mater Sol Cells. 2021;219:110757. doi:10.1016/j.solmat.2020.110757
- Bhaduri S, Adothu B, Aly SP, Alberts V. Performance and safety evaluation of PV cleaning robots in desert environment. Sol Energy. 2026;317:114968. doi:10.1016/j.solener.2026.114968
- Aïssa B, Isaifan RJ, Figgis BW, et al. A comprehensive review of a decade of field PV soiling assessment in QEERI’s outdoor test facility in Qatar: learned lessons and recommendations. Energies. 2023;16(13):5224. doi:10.3390/en16135224
- San Vicente G, Germán N, Farchado M, Morales Á, Santamaría P, Fernández-García A. Study of abrasion tests for antireflective and antisoiling/antireflective coatings on glass solar tubes. Sol Energy. 2023;252:134–144. doi:10.1016/j.solener.2023.01.055