
Introduction
AMOS and SmartPLS are popular tools for structural equation modeling (SEM), but choosing between them requires more than comparing software features. SmartPLS 4 supports both covariance-based SEM (CB-SEM) and partial least squares SEM (PLS-SEM), so the comparison is not simply AMOS versus PLS-SEM.
For PhD and master’s researchers, the appropriate choice depends on the research objective, construct specification, data characteristics, estimator and evidence required. This guide compares both packages and presents a five-decision framework for selecting an appropriate SEM approach.
AMOS vs SmartPLS: Software Capabilities
Capability | IBM SPSS AMOS | SmartPLS 4 |
Model specification | Graphical path diagrams | Graphical model editor |
CB-SEM and CFA | Yes; covariance-based modeling | Yes; includes maximum-likelihood estimation |
PLS-SEM | Primarily a CB-SEM environment | Yes; includes PLS-SEM and PLSc |
Model assessment | Covariance-based fit and parameter assessment | Method-specific CB-SEM and PLS-SEM assessment |
Predictive assessment | Depends on the analysis workflow | PLSpredict and CVPAT |
Ordinal-data analysis | Includes a documented Bayesian procedure for ordinal data | Depends on the selected method and indicator treatment |
Platform | Windows | Desktop platform support depends on the current release |
SmartPLS documents distinct CB-SEM, PLS-SEM and predictive-assessment workflows. AMOS software provides a dedicated covariance-based modeling environment. Researchers should verify current version-specific capabilities and estimator requirements before choosing either package [1–4].
SEM Software capability does not establish methodological suitability. A package may support a procedure without making its assumptions appropriate for a particular research question or dataset.
CB-SEM vs PLS-SEM: The Statistical Difference
CB-SEM generally defines constructs in terms of latent common factors and estimates the parameters of the model based on their covariation structure. A researcher may use goodness-of-fit indexes such as the chi-square statistic, CFI, TLI, RMSEA and SRMR.
PLS-SEM uses a variance-oriented estimation procedure and commonly represents constructs through composites. Its assessment considers measurement quality, structural relationships, explained variance and, where relevant, out-of-sample predictive performance.
Consistent PLS (PLSc) adjusts PLS estimates for specified common-factor models under relevant conditions. It does not make every PLS-SEM analysis equivalent to conventional CB-SEM [5, 6].
Neither method is exclusively confirmatory or exploratory. Both can support theory-driven research, but their estimation objectives and evaluation procedures differ.
The Five-Decision SEM Selection Test
- Research objective: Is the main goal theory testing, measurement validation, explanation or prediction?
- Construct representation: Are the constructs common factors, composites or another theoretically justified specification?
- Estimator suitability: How should response scales, distributions and missing observations be handled?
- Sample adequacy: Is the available sample sufficient for the intended estimates and inference?
- Required evidence: Does the study need global fit assessment, indirect-effect inference, out-of-sample prediction or several of these?
These decisions should determine the analytical approach before software is selected.
Reflective Measurement, Formative Measurement and Composites
In reflective measurement, indicators are treated as manifestations of an underlying construct. In formative measurement, indicators contribute to defining the construct. A composite, by contrast, is a construct representation formed from a weighted combination of components.
These concepts are related but not interchangeable. Formative measurement describes a theoretical measurement relationship, whereas composite modeling describes a statistical representation.
Assessment | Reflective common-factor model | Formative or composite specification |
Main question | Do indicators represent the underlying construct? | Do components adequately define the intended construct? |
Relevant evidence | Loadings, reliability, convergent and discriminant validity | Weights, uncertainty, collinearity and content coverage |
Possible procedures | CFA, reliability coefficients, AVE and HTMT where appropriate | VIF, bootstrap inference and redundancy analysis where justified |
For example, customer satisfaction might be modelled as a common factor measured by several questionnaire items. A service-quality index combining accessibility, reliability and affordability might instead be defined as a composite.
The appropriate specification depends on the theory and meaning of the construct, not the software selected. Misspecification can change the interpretation of structural paths and undermine the validity of the conclusions [5, 6].
Likert-Scale Data: Does the Estimator Matter?
Yes. The number of categories that appear in the responses does not by itself define which SEM methodology is to be used. If a survey contains five-categories satisfaction questions, wherein 85 percent of the sample answers 4 or 5, then that implies that the data is concentrated on the higher side; but that does not mean ML is sufficient for analyzing the data.
Researchers should examine category frequencies, sparse responses, skewness, model specification and the estimator’s assumptions. They must also distinguish treating ordinal indicators as approximately continuous from modeling them explicitly as ordinal.
AMOS documents a Bayesian procedure for ordinal-data analysis. SmartPLS users should likewise establish how the selected procedure handles their indicators and what assumptions apply [3, 4].
A defensible thesis explains the indicator treatment and estimator choice. Where appropriate, sensitivity analysis using a justified alternative estimator can reveal whether substantive conclusions depend on those decisions.
Worked Example: Customer Satisfaction and Customer Loyalty
Suppose a thesis investigates whether perceived service quality influences customer loyalty through customer satisfaction. Each construct is measured using four questionnaire items.
If the constructs are specified as common factors, a CB-SEM model can evaluate the measurement structure and estimate the structural paths. AMOS and SmartPLS’s CB-SEM functionality may both be suitable, subject to identification, estimator and data requirements.
If service quality is theoretically defined as a composite of reliability, accessibility and responsiveness, the researcher must reconsider the construct representation. PLS-SEM may be appropriate if the composite specification and research objective support that choice.
Consider these hypothetical results, included to illustrate interpretation rather than report actual research findings.
Relationship | Standardized estimate | Illustrative 95% CI |
Service quality → Satisfaction | 0.45 | 0.30 to 0.59 |
Satisfaction → Loyalty | 0.35 | 0.18 to 0.51 |
Indirect effect | 0.16 | 0.07 to 0.27 |
The product of the two path estimates is . The indirect-effect confidence interval must be estimated using an appropriate inference procedure; it cannot be obtained by multiplying the endpoints of the two path confidence intervals.
Because the illustrative indirect-effect interval excludes zero, it provides evidence against a zero indirect effect at the corresponding two-sided 5% level, assuming the interval procedure is appropriate. It does not independently establish causality.
The example also illustrates an important distinction: changing software does not necessarily change the statistical model. The construct definition and estimation approach determine what the results mean.
Model Fit vs Predictive Performance
Different evaluation measures answer different questions.
Research question | Relevant evidence | What it does not establish |
Does the CB-SEM model reproduce the observed covariance structure adequately? | Chi-square, CFI, TLI, RMSEA and SRMR, where appropriate | That the model is the only plausible explanation |
How much in-sample variance is explained? | R² | Accurate prediction for new observations |
Does the model predict held-out observations? | Cross-validated errors from PLSpredict | Causal validity |
Does predictive performance exceed a benchmark? | CVPAT or another suitable comparison | That every model assumption is satisfied |
SmartPLS provides PLSpredict for cross-validated prediction assessment and CVPAT for statistical comparisons against prediction benchmarks [7, 8].
A model can fit observed data reasonably well without predicting new observations accurately. Conversely, strong predictive performance does not prove that the proposed theoretical mechanism is correct. Prediction should therefore be evaluated directly when it is a research objective, rather than inferred from R², significant path coefficients or global model fit alone.
SEM Sample-Size Planning and Diagnostics
There is no universal minimum sample size that guarantees reliable SEM results. Statistical power, estimation stability, convergence and confidence-interval precision are related but distinct considerations.
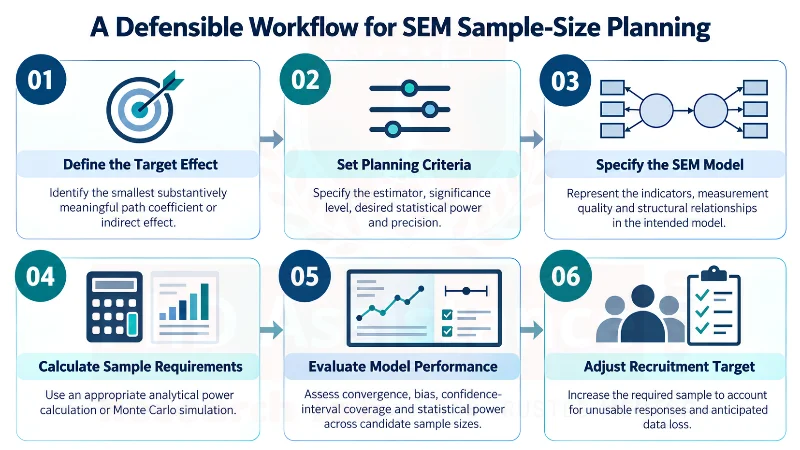
For example, a researcher planning a latent-variable mediation study could simulate candidate sample sizes using assumed path coefficients, indicator loadings, missingness and a prespecified significance level. The researcher would then identify sample sizes that achieve the required power and acceptable estimation performance under those assumptions. The result would be specific to the proposed model, not a universal SEM threshold.
For PLS-SEM, the inverse square root and gamma-exponential methods offer alternatives to the ten-times rule, although their assumptions and applicability must still be considered [9].
After estimation, check identification, convergence, improper solutions, missing-data handling, measurement evidence and uncertainty in structural estimates. Apply diagnostics appropriate to the selected method.
Common SEM Selection Mistakes
Mistake | Why it matters | Better practice |
Selecting SmartPLS merely on account of sample size | The estimates could be unstable or under-powered | Justify sample suitability and precision |
Selecting PLS-SEM based on higher R² value | The estimation goal and specifications may vary | Define what is estimated and research goal |
Confusing formative measurement for composites | Measurement orientation and statistical approach may vary | Justify construct specification |
Concluding that an ordinal variable is continuous automatically | The approximation could contradict estimation properties | Check distribution and measurement of categories |
Claiming mediation implies causation | Statistical mediation does not establish a causal mechanism | Consider study design and confounding mechanisms |
Selecting software producing good results | Such selection may lead to selective reporting | Prespecify your analysis procedure and follow it |
How PhD Assistance Can Support Your SEM Analysis
Choosing between AMOS and SmartPLS requires more than comparing software features. PhD Assistance Data Analysis Services helps PhD and master’s researchers select an appropriate SEM approach, assess measurement and structural models, justify sample-size requirements, evaluate mediation effects, and interpret model fit and predictive performance.
Get expert support with statistical analysis and clear, thesis-ready reporting aligned with your research objectives.
Conclusion
AMOS provides a dedicated covariance-based SEM workflow, while SmartPLS supports CB-SEM, PLS-SEM and additional predictive procedures. The appropriate choice depends on the research objective, construct representation, data characteristics, estimator and required evidence.
A defensible SEM analysis begins with the research question and theoretical model—not the software package. Correct specification, suitable estimation and transparent reporting matter more than software popularity or the apparent favourability of the results.
Frequently Asked Question
Is AMOS better than SmartPLS for SEM?
Neither is universally better. AMOS is primarily used for CB-SEM, while SmartPLS supports both CB-SEM and PLS-SEM. The appropriate choice depends on the model, data and analytical objective.
Can SmartPLS perform confirmatory factor analysis?
Yes. SmartPLS 4 supports CFA through its CB-SEM functionality, including maximum-likelihood estimation. Researchers should verify that the model and data meet the selected procedure’s requirements.
Which software is suitable for Likert-scale data?
Suitability depends on category frequencies, response distributions, model specification and estimator assumptions. Researchers should justify how ordinal indicators are treated rather than selecting software solely on the number of response categories.
Does SmartPLS support prediction?
Yes. PLSpredict assesses cross-validated prediction errors, while CVPAT compares predictive performance against benchmarks. R² alone is insufficient to establish out-of-sample predictive performance.
How should I justify SEM sample size in my thesis?
Base the justification on the minimum effect of interest, statistical power, model complexity, estimator assumptions and desired precision. Use an appropriate analytical calculation or model-specific simulation instead of relying solely on a universal minimum or the ten-times rule.
Reference
- IBM SPSS Amos: Structural Equation Modeling. https://www.ibm.com/products/structural-equation-modeling-sem
- Covariance-Based Structural Equation Modeling (CB-SEM). https://smartpls.com/documentation/algorithms-and-techniques/cbsem/
- Performing an Analysis with Ordinal Data in Amos. https://docs.amosdevelopment.com/HTML/8024.html
- PLS-SEM in SmartPLS. https://smartpls.com/documentation/stories/capabilities/smartpls-pls-sem/
- Dash, G., & Paul, J. (2021). CB-SEM vs PLS-SEM methods for research in social sciences and technology forecasting. Technological Forecasting and Social Change, 173, 121092. https://doi.org/10.1016/j.techfore.2021.121092
- Sarstedt, M., Hair, J. F., Ringle, C. M., Thiele, K. O., & Gudergan, S. P. (2016). Estimation issues with PLS and CBSEM: Where the bias lies! Journal of Business Research, 69(10), 3998–4010. https://doi.org/10.1016/j.jbusres.2016.06.007
- PLSpredict: Assessing Predictive Power in PLS-SEM. https://smartpls.com/documentation/algorithms-and-techniques/prediction-and-segmentation/predict/
- Cross-Validated Predictive Ability Test (CVPAT) in PLS-SEM. https://smartpls.com/documentation/algorithms-and-techniques/resampling-and-inference/cvpat/
- Kock, N., & Hadaya, P. (2018). Minimum sample size estimation in PLS-SEM: The inverse square root and gamma-exponential methods. Information Systems Journal, 28(1), 227–261. https://doi.org/10.1111/isj.12131