
Introduction
Summary
Choosing between AMOS and SmartPLS is an important methodological decision for management PhD researchers working with small UK and Gulf samples. AMOS is commonly used for covariance-based structural equation modelling (CB-SEM), particularly for theory testing and model-fit assessment. SmartPLS supports partial least squares structural equation modelling (PLS-SEM), with an emphasis on explained variance and prediction. However, neither software automatically solves small-sample limitations. Researchers should consider their research objectives, measurement models, model complexity, statistical power, and data quality before selecting an approach. Careful assessment of reflective and formative constructs, reliability, validity, and model relationships helps strengthen the analysis. A clear methodological justification supports credible findings and transparent thesis reporting.
A small survey sample can make a management PhD feel harder than it needs to be. Perhaps access to UK managers is limited, a Gulf organisation has approved only a modest number of responses, or recruitment has taken longer than planned. At this point, researchers often search for an AMOS vs SmartPLS comparison to decide which approach is suitable. This question is common in SEM for PhD research, where the method must be justified rather than chosen for convenience.
The useful answer is not that one program is always better. AMOS is commonly used for covariance-based structural equation modelling (CB-SEM), while SmartPLS is widely associated with partial least squares structural equation modelling (PLS-SEM). When comparing AMOS vs SmartPLS for SEM, one needs to separate the software from the methodology used. It all comes down to the research problem, measurement approach, complexity of the model, and data – not the sample size only (Dash & Paul, 2021; Hair et al., 2022).
1. AMOS and SmartPLS: Key Differences
AMOS and SmartPLS are software tools used for structural equation modelling (SEM) to investigate the relationships among nonobservable constructs such as leadership ability, employee motivation, trust, and technology adoption intention. These constructs are measured based on indicators, which can be questionnaire items in this case, and the relationship among the variables is established through a model. In the case of SEM analysis for management research, this can facilitate investigating the relationship among multiple predictors and outcome variables in one model.
AMOS generally supports a covariance-based approach that is well suited to testing a theoretically specified model and assessing how well the model reproduces relationships in the data. SmartPLS estimates a PLS path model, with a strong emphasis on explaining variance in target constructs and assessing predictive performance. PLS-SEM can also accommodate composite measurement and complex models, but it should not be treated as a shortcut around sound design or adequate data (Hair et al., 2021, 2024).
Table 1. AMOS vs. SmartPLS at a glance
Decision point | AMOS (typically CB-SEM) | SmartPLS (PLS-SEM) |
Main emphasis | Theory testing and model fit | Explained variance and prediction |
Measurement logic | Common-factor models are typical | Composite models and factor models can be specified, with appropriate justification |
Small samples | May be challenging when data or model requirements are not met | Can be suitable in some cases, but sample adequacy still needs evidence |
Model evaluation | Global fit plus parameter and measurement assessment | Measurement and structural assessment, including predictive checks where relevant |
Best first question | Does the proposed theory reproduce the observed covariance structure adequately? | How well does the model explain or predict target constructs? |
2. Selecting an SEM Approach Based on the Research Aim
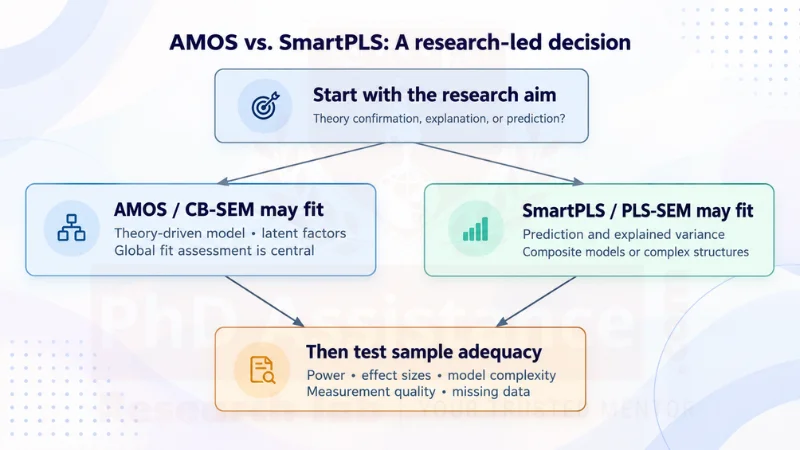
Figure 1. A research-led route to choosing between AMOS and SmartPLS.
Consider a PhD examining whether transformational leadership influences employee engagement and, in turn, intention to stay. If the study is grounded in an established theory and the main purpose is to confirm proposed relationships and evaluate overall model fit, AMOS may be the more natural starting point provided the sample and data meet the method’s requirements. This is one reason choosing SEM software for a PhD should begin with the research aim, not the number of responses alone.
Now imagine a study exploring which factors best predict digital-service adoption among small businesses, where the model includes several predictors and the study has a strong prediction-oriented purpose. SmartPLS may be appropriate if the constructs and measurement specifications justify PLS-SEM. It is one option within the wider range of SEM software for management research. This distinction is central to CB-SEM vs PLS-SEM: the methods have different emphases, but neither should be treated as universally superior. The decision should be defended in the methodology chapter, not based on which interface feels easier to use (Dash & Paul, 2021; Hair et al., 2024).
3. Small-Sample Considerations for SmartPLS
This is the most important caution for PhD researchers: SmartPLS does not automatically make a small sample sufficient. A search for SmartPLS for small samples or AMOS or SmartPLS for small sample size should lead to a methodological answer, not a promise that software can compensate for weak data. PLS-SEM can be useful with small-to-moderate samples in suitable conditions, but adequacy depends on the smallest effect the study needs to detect, the number of predictors pointing to a construct, model complexity, measurement reliability, and desired statistical power.
Avoid relying on the familiar “10-times rule” as the only justification. It is a rough rule of thumb and can produce misleading minimum sample estimates. A defensible PLS-SEM sample size rationale should use a suitable power analysis or method-specific approach, state the assumptions, and explain recruitment constraints. If the available sample is too small to detect meaningful effects, changing software cannot repair that limitation (Hair et al., 2021, 2022).
Table 2. A practical decision guide for small samples
If your study… | A reasonable next step |
Tests an established theory and needs global model-fit assessment | Evaluate AMOS / CB-SEM suitability and check sample and data assumptions. |
Prioritises prediction and explained variance | Assess whether SmartPLS / PLS-SEM fits the research objective and construct specification. |
Has a small sample but complex paths | Run a power or sample-size assessment before selecting software; simplify only if theory permits. |
Compares UK and Gulf groups | Check measurement comparability/invariance and group-specific sample adequacy before comparing paths. |
Has weak or inconsistent questionnaire measures | Review construct definitions, item quality, translation, and data screening before estimation. |
4. Key Considerations for UK and Gulf Management PhDs
For SEM analysis for UK PhD research and SEM for Gulf management research, the location itself does not determine the correct technique. What counts is how the sampling process was carried out, and how well the sample represents the target population. For instance, a study that targets senior executives from several Gulf countries could be constrained by various factors. A UK study recruiting through one professional association may face a different coverage problem.
Before running either program, check the following:
- Describe the population and sampling procedure. Clarify who was eligible, how the participants were recruited, and where the sample is possibly underrepresented.
- Revisit the measurement model. Make sure that the questionnaire items capture the definitions of the constructs. Translate and adapt measures where necessary. Do not assume that an instrument works in the same way in all contexts.
- Check the data. Inspect missing data, outliers, patterns of responding, and distributional properties prior to the estimation stage.
- Decide on how to analyse the data before selecting the software. Identify the important paths, any mediation/moderation effects to be examined, controls, and the criteria for assessing the measurement and structural models.
- State the limitations of the study. Recognise problems such as low response rate and limited generalizability rather than treat software selection as their resolution.
These steps reflect sound practice in Quantitative Statistics: the aim is to match the analysis to the design and keep conclusions proportionate to the evidence.
5. Reporting Results Without Overclaiming
A strong results chapter does more than list significant paths. Report the measurement model first, including relevant reliability and validity evidence. Then explain the structural results, the size and direction of estimated relationships, uncertainty, and practical meaning. For AMOS, include appropriate model-fit indices and explain how they inform the assessment; do not rely on one index alone. For SmartPLS, report relevant measurement checks and structural assessment, including explained variance and predictive evaluation where appropriate.
Avoid saying a hypothesis is “proven.” A significant association does not by itself establish causality; causal language requires a suitable design and assumptions, not just a path diagram. Likewise, a non-significant result does not prove that no relationship exists, as estimates may be imprecise when the sample is limited.
Researchers who need to verify model specification, interpret output, or document reproducible analysis may benefit from structured support with Software Programming alongside methodological decisions. The goal is to understand and explain the analysis, not simply obtain tables from a program.
6. A simple decision rule
Use AMOS when your study is primarily theory-confirmatory, the constructs are appropriately represented as common factors, and covariance-based model assessment aligns with your objectives and data. Consider SmartPLS when prediction and explained variance are central, composite constructs are theoretically justified, or the model’s characteristics support a PLS-SEM approach. In either case, justify the method, assess sample adequacy, and report all key decisions transparently.
If you are unsure, write a short analysis plan before opening either tool: state the research aim, construct definitions, measurement type, hypotheses, expected effect sizes, sample-size rationale, and evaluation criteria. This one-page plan often makes the choice clearer and helps keep the methods chapter coherent.
Conclusion
For management PhDs with small UK or Gulf samples, the best SEM tool is the one that fits the research purpose and can be justified with evidence. AMOS is not automatically unsuitable for a modest sample, and SmartPLS is not a universal fix for limited data. Start with theory and measurement, assess sample adequacy, then select the method that answers the research question responsibly. A transparent rationale will strengthen the thesis more than choosing software because it appears more forgiving.
Need help choosing between AMOS and SmartPLS for your management PhD? PhD Assistance provides Data Analysis support to help you plan your analysis, assess your methodology, and interpret results with clarity. Get expert guidance to strengthen your research methodology and thesis reporting. Typical deliverables include a documented analysis plan, a sample-adequacy assessment, and a results section written to match your model and data.
Frequently Asked Question
1. What is the main difference between AMOS and SmartPLS?
AMOS is commonly used for CB-SEM and theory testing, while SmartPLS focuses on PLS-SEM, explained variance, and prediction.
2. Is SmartPLS suitable for small samples?
It may be suitable under certain conditions, but sample adequacy depends on statistical power, model complexity, expected effect sizes, and measurement quality.
3. How should researchers determine the minimum sample size for PLS-SEM?
Researchers should use an appropriate power analysis or method-specific sample-size approach rather than relying only on the 10-times rule.
Reference
- Dash, G., & Paul, J. (2021). CB-SEM vs PLS-SEM methods for research in social sciences and technology forecasting. Technological Forecasting and Social Change, 173, Article 121092. https://doi.org/10.1016/j.techfore.2021.121092
- Hair, J. F., Hult, G. T. M., Ringle, C. M., Sarstedt, M., Danks, N. P., & Ray, S. (2021). Partial least squares structural equation modeling (PLS-SEM) using R: A workbook. Springer. https://doi.org/10.1007/978-3-030-80519-7
- Hair, J. F., Hult, G. T. M., Ringle, C. M., & Sarstedt, M. (2022). A primer on partial least squares structural equation modeling (PLS-SEM) (3rd ed.). SAGE Publications.
- Hair, J. F., Sarstedt, M., Ringle, C. M., & Gudergan, S. P. (2024). Advanced issues in partial least squares structural equation modeling (PLS-SEM) (2nd ed.). SAGE Publications.