
The source and why it matters
This review examines Roshid et al. (2025), "Mapping the carbon finance research: A bibliometric exploration of innovation in sustainable finance", which appeared in 2025 in Development and Sustainability in Economics and Finance. Its five authors work at universities in Bangladesh and at Michigan Technological University in the United States.
Carbon finance is the set of markets and financial instruments that price, trade or fund cuts in greenhouse gas emissions. Emissions trading systems, carbon credits and offsets, and labelled bonds all belong to it. Because the literature has expanded fast and straddles finance, environmental economics and public policy, a doctoral researcher entering the area needs some way to see its overall shape. Bibliometric analysis supplies that view by applying quantitative techniques to publication records (Donthu et al., 2021).
What the paper reports
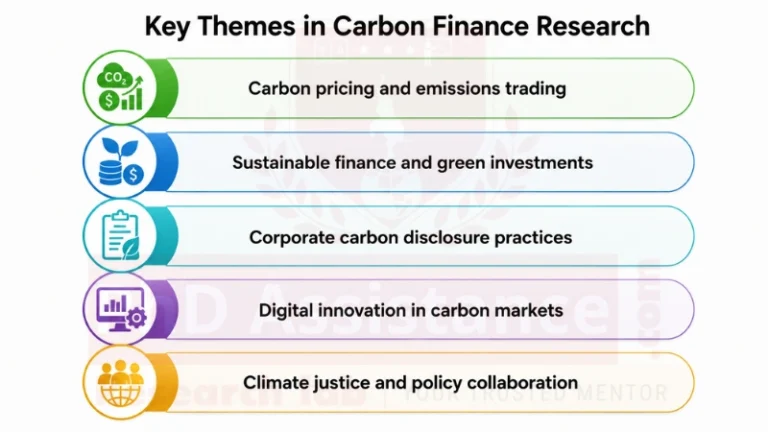
The abstract describes a study that follows carbon finance research from its founding concepts through to its use in corporate sustainability. The authors identify the most influential authors, journals, institutions and countries, trace patterns of collaboration, and sort the literature into research domains (Roshid et al., 2025). The table gathers the main results.
| Dimension | What the paper reports |
|---|---|
| Core research domains | Carbon pricing mechanisms, corporate carbon disclosure, carbon financialisation, and implications for developing economies |
| Geography of production | Research networks concentrated in Europe, North America and Asia |
| Collaboration | International partnerships strengthening the field |
| Emerging directions | Integration of carbon finance with sustainable finance, digitalisation and innovation in carbon markets, and climate justice |
| Keywords | Bibliometric analysis, carbon finance, environmental finance, sustainable finance, sustainable innovations |
What the paper offers, then, is description and organisation. It shows where research activity clusters and which themes are gaining ground. It does not ask whether carbon finance instruments achieve their aims, so its results cannot be cited as evidence on that question.
Strengths
- A timely overview of a scattered field. Carbon finance studies are spread across several disciplines, and a structured overview helps newcomers locate the central debates quickly.
- Several units of analysis. By examining authors, journals, institutions, countries and collaborations together, the study connects who produces the research with where it is published.
- Attention to emerging themes. Flagging the digitalisation of carbon markets and climate justice directs readers towards questions that remain unsettled.
- Developing economies as a domain. Giving developing-economy implications their own place offsets a literature that tends to concentrate on European and Chinese markets.
Limitations and methodological issues
The database and the query shape the map
A bibliometric map can only show what its database contains. Scopus and Web of Science cover different sets of journals, and each under-represents the social sciences, work in languages other than English, and some regions (Mongeon & Paul-Hus, 2016). One consequence is that a map drawn from a single source will inflate some countries and shrink others.
The search string has an equally strong effect. Carbon finance borders on climate finance, green finance and emissions trading, and the chosen terms decide which of these neighbouring bodies of work enter the sample. To judge the map, a reader needs the database, the exact query, the extraction date and the cleaning steps. These details should be reported in full and checked before anyone relies on the findings; current design frameworks treat them as part of the research design rather than as technical footnotes (Öztürk et al., 2024).
Counting and mapping are not appraisal
Bibliometric studies usually pair two techniques. Performance analysis counts publications and citations by author, institution or country. Science mapping uses co-citation, bibliographic coupling or co-word analysis to reveal the intellectual structure of a field (Zupic & Čater, 2015; Donthu et al., 2021). Both describe patterns in records; neither tests whether the underlying studies are sound. The Leiden Manifesto makes the same point when it argues that indicators should support expert judgement, not replace it (Hicks et al., 2015).
The live critique called the paper "predominantly descriptive". That is a fair description, yet it is partly a feature of the method itself. The remedy is to read the core studies critically alongside the map. Lim and Kumar (2024) offer a practical route, moving from scanning the results, to sensing what they might mean, to substantiating each interpretation against the papers themselves.
Claims about maturity need criteria
Describing a field as "emerging" or "maturing" requires explicit tests. Keathley-Herring et al. (2016) set out a framework for judging research-area maturity that looks past publication growth to features such as theoretical development and methodological variety. Applying such criteria would turn the paper's story of progression into a judgement that others could check.
Theory and the policy debate
The live review observed that no guiding theory frames the paper. A natural candidate is the argument of Campiglio (2016): because of market failures in credit creation, carbon pricing on its own may not shift bank lending towards low-carbon activity, so monetary and macroprudential tools may be needed as well. A map organised around contests of this kind, such as price-based against credit-based instruments, would tell readers what is actually in dispute.
Credibility, greenwashing and offsets
The most important substantive gap is whether instruments deliver what they promise. Lu et al. (2024) found that issuing carbon neutrality bonds lowered Chinese firms' emissions while also raising greenwashing and liquidity risks. West et al. (2023) used synthetic control methods on 26 avoided-deforestation offset projects and found that most had not significantly reduced deforestation, and that where reductions did occur they were far smaller than claimed. A map that does not separate studies of claimed impact from studies of verified impact risks overstating how far the field has progressed. Work published since 2024, reviewed below, makes this gap considerably sharper.
How the paper sits in the wider literature
Earlier mapping studies cover similar ground. Mashari et al. (2023) analysed 506 Scopus articles from 2014 to 2022 with VOSviewer and concluded that there is ample scope to connect green finance with carbon trading. Setting the two maps side by side would show whether the field's structure holds steady under different search designs.
The empirical studies these maps summarise define and measure carbon finance in very different ways, and any review has to account for that.
| Study | How carbon finance is measured | Setting and method | Main finding |
|---|---|---|---|
| Mohsin et al. (2021) | Composite low carbon finance index (DEA-like) | Developed and developing economies | Country scores vary widely; developing countries may comply only partly |
| Chen and Ma (2024) | Provincial carbon finance development | 30 Chinese provinces; spatial econometrics | Carbon finance improves green economic efficiency, with spillovers strongest in the east |
| Lu et al. (2024) | Issuance of carbon neutrality bonds | Chinese firms; fixed effects and system GMM | Emissions fall, but greenwashing and liquidity risks rise |
| West et al. (2023) | Verified deforestation in offset projects | 26 projects in six countries; synthetic controls | Most projects did not significantly reduce deforestation |
Since the measures range from national indices (Mohsin et al., 2021) and provincial development levels (Chen & Ma, 2024) to firm-level bond issuance and project-level outcomes, their findings cannot simply be pooled. A large share of the evidence also comes from China, which a doctoral reviewer should acknowledge before generalising.
Reading the emerging themes critically
The emerging directions identified by the paper are good prompts, but each needs unpacking before it can carry a thesis.
- Integration with sustainable finance. As carbon finance merges with green and sustainable finance, the boundaries blur. A review should state which instruments it covers, or it will end up comparing unlike things.
- Digitalisation of carbon markets. Digital registries and monitoring may improve the tracking of credits, but a rising number of papers on a technology does not show that it improves integrity. Check whether studies measure verified outcomes or only describe potential.
- Climate justice. This theme asks who bears the costs of carbon markets and who gains. Much of the work appears outside finance journals, so a finance-centred search may miss it.
- Developing economies. Campiglio (2016) suggests that credit-based policies may be more workable in emerging economies, where central banks often hold wider powers. That links the paper's developing-economy domain to a concrete policy question a doctoral study could pursue.
In every case, the bibliometric signal shows only that researchers are writing about a topic. Whether the topic is under-studied relative to its importance, and whether the existing work is rigorous, are separate questions that only close reading can answer.
What newer research adds (2024 to 2026)
Several studies published since 2024 bear directly on the domains the paper maps. The table summarises ten of them, grouped into evidence on carbon pricing, on credits and offsets, on labelled finance, and on bibliometric method.
| Study | Design and data | Key finding | What it means for the reviewed paper |
|---|---|---|---|
| Döbbeling-Hildebrandt et al. (2024) | Machine-learning-assisted systematic review and meta-analysis; 483 effect sizes from 80 causal ex-post evaluations of 21 carbon pricing schemes | Immediate, substantial reductions for at least 17 schemes; significant effects of -5% to -21% (-4% to -15% after correcting for publication bias) | The carbon pricing domain now has synthesised causal evidence that a map should distinguish from descriptive work |
| Colmer et al. (2025) | Firm-level administrative data on manufacturing firms regulated by the EU ETS | Emissions fell by 14% to 16% on average, with no detectable contraction in economic activity and no evidence of outsourcing | Shows a price instrument working at firm level, a result a debate-centred map should register |
| Probst et al. (2024) | Synthesis of 14 studies on 2,346 crediting projects and 51 studies of similar interventions without credits; almost 1 billion tonnes of CO2e | Less than 16% of credits issued to the projects studied are estimated to be real emission reductions | Integrity, not volume, is the central open question for credit markets |
| Trencher et al. (2024) | Original company-level dataset on the 20 firms retiring the most voluntary offsets, 2020 to 2023 | 87% of the offsets carry a high risk of not delivering real and additional reductions | The corporate disclosure domain needs to examine the quality of the offsets firms report |
| Romm et al. (2025) | Systematic literature review of offset programmes | Widely used programmes substantially overestimate climate benefits; problems with additionality, leakage, double counting, permanence and verification persist | Supports separating claimed from verified impact in any map of the field |
| Demski et al. (2025) | BIS analysis of 39 countries, 2011 to 2022, plus a firm-level sample of 736 green bond issuers | Green bond markets grew most where emissions targets were stricter; issuance in heavy-emitting sectors was followed by significant emission reductions | Labelled finance evidence is mixed rather than uniformly negative |
| Wang and Xu (2025) | Bibliometric analysis of 2,101 SSCI articles on sustainable finance, 2004 to 2025, from Web of Science; CiteSpace and VOSviewer | Four thematic clusters; a shift from theoretical climate finance towards green bonds and credit policy | An independent map of a neighbouring field against which the paper's structure can be compared |
| Öztürk et al. (2024) | Methodological overview and framework | Sets out the stages and steps of bibliometric research design, not only analysis | Supplies criteria for judging the paper's unreported design choices |
| Lim and Kumar (2024) | Methodological guidance | Proposes scanning, sensing and substantiating as stages in interpreting bibliometric results | Cluster labels such as "emerging" need substantiation against the studies |
| Culbert et al. (2025) | Comparison of 16.8 million publications shared by OpenAlex, Web of Science and Scopus | OpenAlex has comparable reference coverage, but all three sources show data-quality problems | Open data can make maps reproducible, provided records are checked |
On carbon pricing, the newer evidence is more encouraging than the live review implied. Döbbeling-Hildebrandt et al. (2024) pooled causal evaluations and found statistically significant emission reductions under most schemes studied, even though prices were low in most instances. Colmer et al. (2025) reached a similar conclusion for the EU ETS with firm-level data, finding no sign that regulated firms simply shifted production elsewhere. Both studies confirm that the paper was right to treat carbon pricing as a core domain. They also show that the domain has moved from description to rigorous impact estimation, something a map built on keywords and citations cannot reveal.
On credits and offsets, the newer work challenges any reading of the field as steady progress. Probst et al. (2024) estimated that fewer than one in six credits issued to the projects they examined reflect real reductions. Trencher et al. (2024) showed that large corporate buyers mostly retired cheap, high-risk offsets, and Romm et al. (2025) concluded from a systematic review that the main quality problems have resisted repeated reform. These findings extend West et al. (2023) from forest projects to the market as a whole and make the integrity of credits the most pressing question in the field.
Labelled finance sits between these poles. Demski et al. (2025) linked green bond growth to stricter national targets and found emission reductions after issuance in heavy-emitting sectors, a more positive result than the greenwashing risks reported by Lu et al. (2024). Meanwhile, Wang and Xu (2025) mapped a neighbouring sustainable finance literature with Web of Science data and found a shift towards green bonds and credit policy, which shows how a different database and query produce a different structure.
Several questions remain open. Few studies yet test whether digital registries improve credit integrity, the distributional effects behind climate justice are still thinly evidenced, and most causal evidence on pricing comes from a limited number of schemes. On method, Öztürk et al. (2024) and Culbert et al. (2025) make it easier to design and reproduce a map, but neither removes the need to read the studies.
What it means for doctoral researchers
Treat the paper as a guide to orientation. Its domains and emerging themes make a sensible first list of search terms and debates. A thesis, however, needs an argument about the evidence, not just a map of it, so the next step is to sort the studies you find by the strength of their designs. Separate causal evaluations and systematic reviews, such as those on carbon pricing and offsets discussed above, from descriptive or self-reported evidence.
Running your own analysis is now straightforward with tools such as the bibliometrix package (Aria & Cuccurullo, 2017), and open sources such as OpenAlex make it possible to share the underlying records (Culbert et al., 2025). Whatever you use, report it in full.
| Report this | Why |
|---|---|
| Database(s) and reasons for the choice | Coverage drives which countries and journals appear |
| Exact query, fields searched and extraction date | Allows the search to be repeated and updated |
| Document types, languages and years included | Defines the population the map describes |
| Cleaning: duplicates, author and keyword synonyms | Uncleaned records split authors and themes |
| Measures and thresholds for maps and clusters | Cluster results change with these settings |
| How clusters were labelled and checked against the papers | Labels are interpretations and need validation |
Worked example: a bibliometric search plan (illustrative)
This plan is hypothetical. A candidate interested in carbon market integrity searches two databases with the query ("carbon finance" OR "carbon market*" OR "emissions trading" OR "carbon credit*" OR "carbon offset*") AND (integrity OR verification OR greenwash*), covering 2010 onwards and recording the date. After merging the records and removing duplicates, she runs a co-word analysis and labels four clusters. She then reads the twenty most cited and twenty most recent papers in the integrity cluster, sorting them by design. Most report claimed rather than verified reductions, while the few rigorous syntheses point to large shortfalls. The gap she defines is the lack of verified evidence for the project types her country relies on. The map directed her reading; the reading produced the argument.
For a related critique of citation-based rankings in finance, see our review of a global finance research evaluation; for turning a map into a question, see research gap identification.
Common mistakes when using bibliometric maps
- Treating publication counts by country as a measure of research quality or leadership.
- Leaving out the database, query and extraction date.
- Reading keyword clusters as findings about the world rather than patterns in indexed records.
- Mixing studies of claimed and verified emission reductions without distinguishing them.
- Citing a map as evidence that an instrument works, when causal evaluations and syntheses exist.
- Generalising from evidence concentrated in one country, such as China, without saying so.
- Stopping at the map instead of reading and appraising the core studies.
Key takeaways
- Roshid et al. (2025) map carbon finance research, finding core domains in carbon pricing, disclosure and financialisation and emerging themes in digitalisation and climate justice.
- Bibliometric results depend on the database, query and cleaning, which must be reported if the map is to be trusted (Mongeon & Paul-Hus, 2016; Donthu et al., 2021; Öztürk et al., 2024).
- Mapping describes a literature without evaluating it, so pair it with critical reading and substantiated interpretation (Hicks et al., 2015; Zupic & Čater, 2015; Lim & Kumar, 2024).
- Newer causal evidence shows that carbon pricing has cut emissions under many schemes (Döbbeling-Hildebrandt et al., 2024; Colmer et al., 2025).
- Offsets and credits have delivered far less than claimed, which makes integrity the field's central open question (Probst et al., 2024; Trencher et al., 2024; West et al., 2023).
- Use the map to orient your reading, then build your gap from the studies themselves.