
Data Analysis Sample Work
Understanding the key factors that influence U.A.E. enterprises' capital structure decisions
Info: 2031 words Sample Data Analysis
Published: 20th DEC 2022
Tagged: Economics & Finance
Introduction
This study aimed to determine how companies in the industry raise capital for investments, either internally or externally, and investigate the factors influencing capital structure in U.A.E. enterprises. The secondary data was used for this study, and it has been collected from the Dubai stock exchange listed non-financial companies. The collected data were entered into excel and analyzed using the SPSS. 22.0 version. Descriptive statistics were performed on the study variables. Correlation analysis was used to correlate two variables, and Regression analysis was used to find the relationship between the independent and dependent variables.
Data Collection
The website https://www.dfm.ae/pages/default.aspx?c=1010 provided the information used in this investigation. This library contains all information about the macroeconomic indicators of the nation. The Global Economy (2014) was also utilized to reference UAE-specific variables. Twelve non-financial companies have been selected for the study. The information was gathered between 2008 and 2012. The country-specific data is collected from various sources, including the World Bank's Financial Structure Database, Euro Monitor International, and World Development Indicators. In this study, the independent variables are firm growth, firm size, return on assets, operating profit, G.D.P. Growth rate, and inflation rate, whereas the dependent variable is the "leverage ratio."
Descriptive statistics
Shuttle Radar Topography Mission (SRTM) 1 Arc-Second Global imagery with a 1-arc resolution was used to produce the DEM for the Upper-Biji Catchment. It was downloaded from the United States Geological Survey (USGS) website. The project area's drainage network and slope maps, which were made using the Upper-Biji Catchment DEM, were used to choose the best locations to erect sand dams. Generally speaking, SRTM is the most significant source of elevation data. Digital elevation data for the entire planet with a resolution of 1 arc-second has been produced using updated SRTM data to fill in missing data gaps (USGS, 2021a).
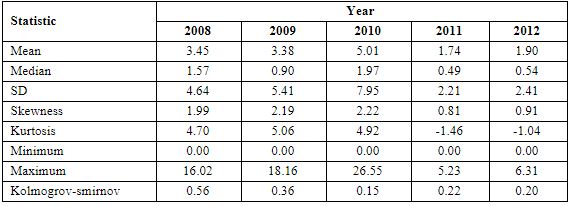
Table 1: Descriptive statistics for a Leverage ratio
Table 1 represents the descriptive statistics for the leverage ratio from 2008 to 2012. U.A.E. nations have comparatively low leverage ratios, with an average ratio ranging from 1.74 to 5.01. U.A.E. has a more excellent leverage ratio than the rest of the world, with a value of 5.01 in 2010, 3.45 in 2008, 3.38 in 2009, 1.90 in 2012, and 1.74 in 2011, with a standard deviation of 0.49 to 1.97. All leverage ratios have a right-skewed skewness, which shows that most are in the lower range. Regarding the kurtosis metric, all years—aside from 2011 and 2012—have a kurtosis value that deviates from the normal distribution pattern (value at three). Leverage ratios demonstrate the non-normality of the error term for all years when examining the formal normality test (using Kolmogorov-Smirnov). As a result, the square root transformation is carried out for the leverage variable.
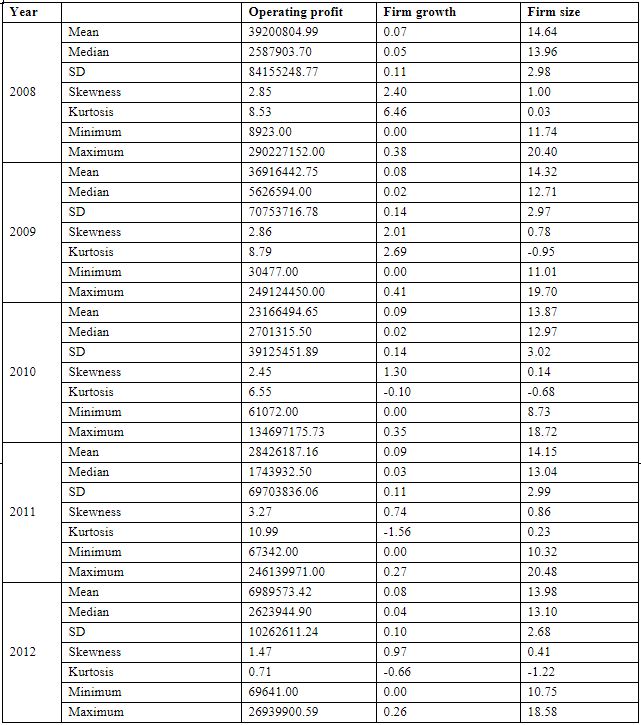
Table 2: Descriptive statistics for Independent variables
Table 2 represents the descriptive statistics for independent variables from 2008 to 2012. The highest annual average operating profit was 39200804.99, with a 0.07 per cent growth in the size of the business, regarding the size expressed by the natural logarithm of income.
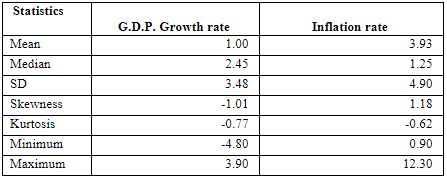
Table 3: Descriptive statistics for Country-specific Determinants
Table 3 represents the descriptive statistics for the variables denoting country-specific determinants. For example, in annual percentage terms, the inflation rate (I.N.F.) ranges from 0.90 per cent to 12.30 per cent with a mean of 3.93 per cent, while the G.D.P. growth rate (GDPRATE) for the U.A.E. countries ranges from minimum -4.80 per cent to 3.90 per cent with a standard of 1.00 per cent.
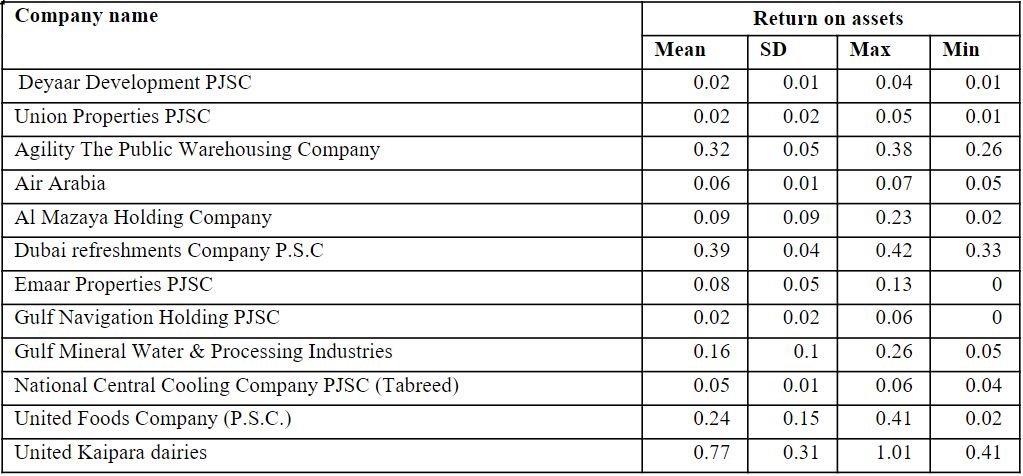
Table 4: Descriptive statistics for Return on assets organization wise
Table 4 represents the descriptive statistics for Return on assets organization-wise. The mean range from 0.02 to 0.77 shows every country's mean, standard deviation, and maximum and minimum values.
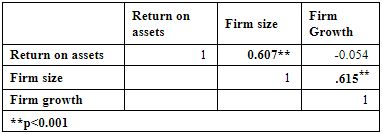
Table 5: Correlation analysis
Table 5 represents the correlation analysis between the Return on assets, Firm size and Firm growth. The explanatory variables don't have a high pairwise association with each other (Operating profit, firm Growth, Non-debt-tax shield and firm size). As a general rule, intercorrelation between the independent variables above 0.80 denotes a potential multicollinearity issue. However, given that a company with more significant operational profits has more prospects for growth because it can use its funds for expansion, this high association is acceptable. The Pearson correlation analysis is shown in the table above. The table demonstrates that there is a significant positive linear association between company size and operating profit, particularly between firm growth (r = 0.615, p<0.001) and operational profit (r = 0.607, p<0.001). The correlation coefficients are positive, which indicates that as the firm size grows, so does operational profit and substantial expansion. Thus, a positive correlation exists between operating profit company growth and fit size.
Regression Analysis
Regression research on business size, non-debt-tax shield, firm growth, and the relationship between leverage and operating profit were utilized to demonstrate the central premise's validity further. Regression analysis is a more powerful and reliable method than correlation since it can quantify the strength of an association, whereas correlation considers a linear relationship. Regression analysis was used because it gave the most precise explanation of the independent variable. The unstandardized factor scores (beta coefficients) and r square expressed the independent variables. The beta coefficients were used to rank the significant variables still included in the regression equation.
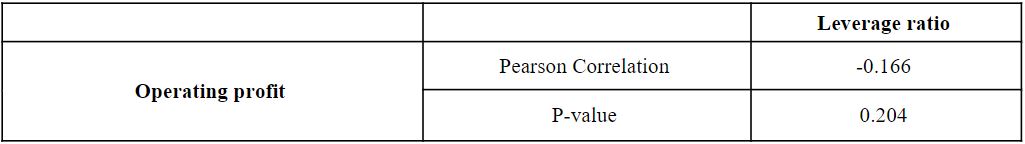
Table 6: Relationship between operating profit and leverage ratio
Table 6 presents the Pearson correlation analysis. It is evident from the table that operating profit does not show a significant linear relationship with leverage ratio in particular operating profit (r = -0.166, p=0.204). Hence there is no significant relationship between operating profit and leverage ratio.
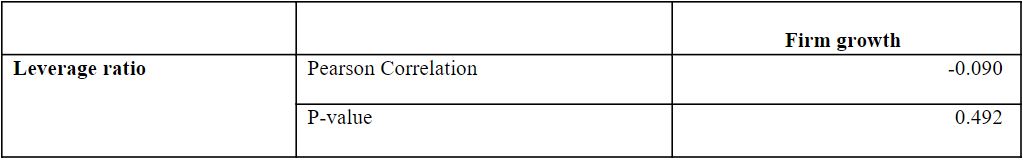
Table 7: Relationship between Firm growth and leverage ratio
Table 7 presents the Pearson correlation analysis. It is evident from the table that operating profit does not show a significant linear relationship with leverage ratio in particular operating profit (r = -0.090, p=0.492). Hence there is no significant relationship between firm growth and leverage ratio.
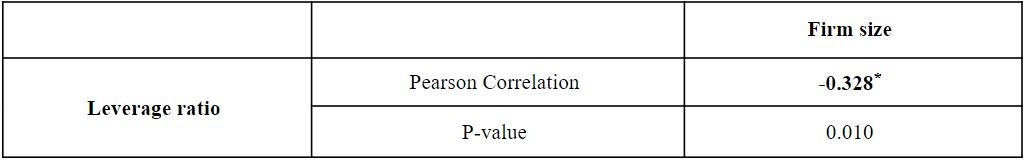
Table 8: Relationship between Firm size and leverage ratio
Table 8 presents the Pearson correlation analysis. It is evident from the table that firm size does show a significant negative linear relationship with leverage ratio in particular firm growth (r = -0.328, p=0.010). The correlation values are negative, meaning the leverage ratio decreases when firm size increases. Hence there is a negative relationship between firm size and leverage ratio.
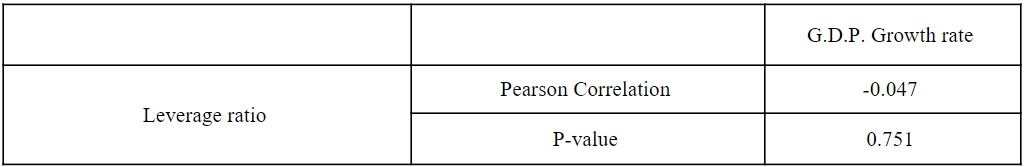
Table 9: Relationship between G.D.P. growth rate and leverage ratio
Table 9 presents the Pearson correlation analysis. It is evident from the table that the G.D.P. growth rate does not show a significant linear relationship with the leverage ratio, in particular, the G.D.P. growth rate (r = -0.047, p=0.751). Hence there is no significant relationship between G.D.P. growth rate and leverage ratio.
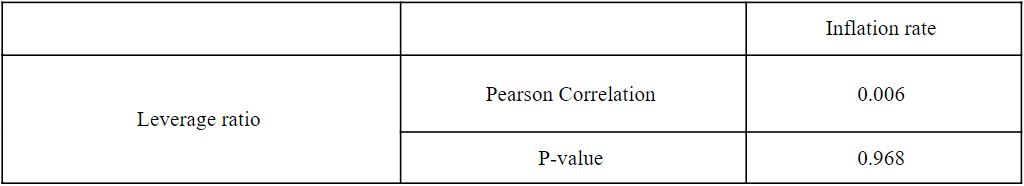
Table 10: Relationship between inflation rate and leverage ratio
Table 10 presents the Pearson correlation analysis. It is evident from the table that the G.D.P. growth rate does not show a significant linear relationship with the leverage ratio, in particular, the G.D.P. growth rate (r = -0.047, p=0.751). Hence there is no significant relationship between G.D.P. growth rate and leverage ratio.
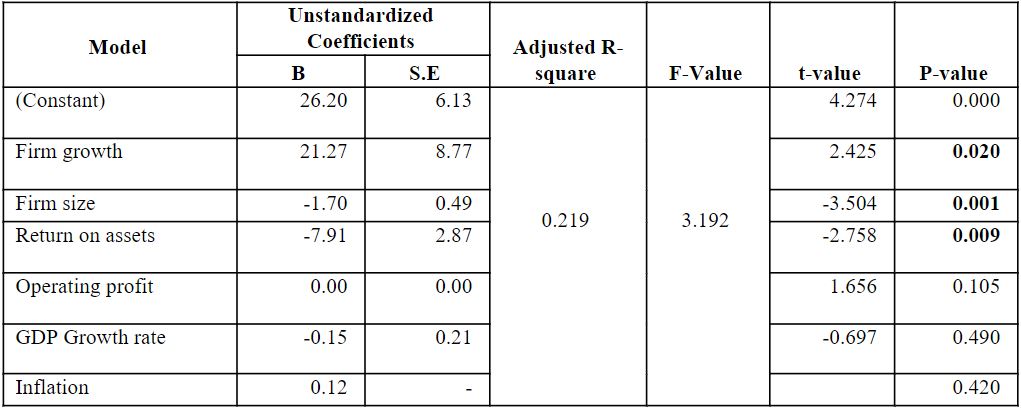
Table 11: Association between leverage ratio and operating profit, firm growth, return on assets, fit size, G.D.P. rate, inflation rate
Dependent variable: leverage ratio
The regression analysis is presented in table 11 above. It is evident from the table of linear regression that the relationship between the leverage ratio and firm growth is significant, as indicated by the beta coefficients for fit size (beta=-1.70, t=-3.504, p=0.001), Return on assets (beta=-7.91, t=-3.504, p=0.009), and leverage ratio (beta=21.27, t=2.425, p=0.020). The null hypothesis is rejected because the significance value is smaller than the alpha value of 0.05, and the supporting hypothesis is therefore accepted. The leverage ratio, business size, and Return on Assets are all significantly correlated. The leverage ratio is a less significant predictor of business growth, size, and return on assets, as seen by the independent variables' combined contribution to variance, which was 21.9%.
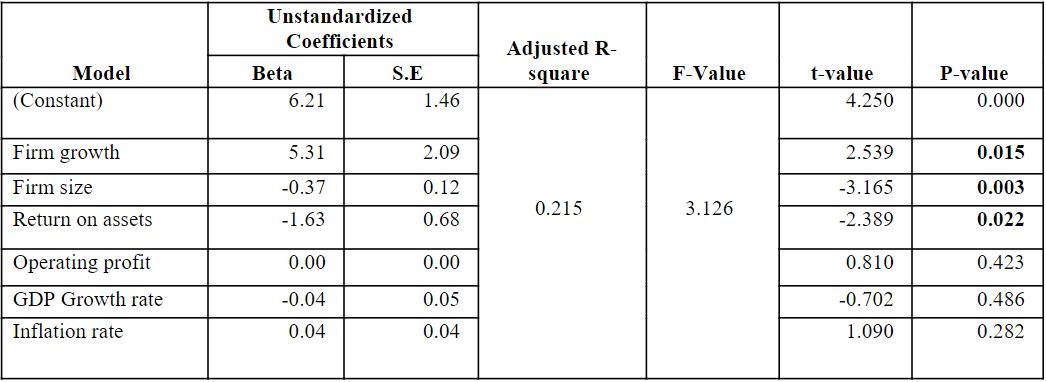
Table 12: Association between leverage ratio and operating profit, firm growth, return on assets, fit size
Dependent variable: square root of the leverage ratio
The regression analysis is shown in Table 12. It is evident from the table of linear regression that the relationship between the leverage ratio and company growth is substantial, as indicated by the beta coefficients for fit size (beta=-0.37, t=-3.165, p=0.003) and returns on assets (beta=-1.63, t=-2.389, p=0.022). The null hypothesis is rejected because the significance value is smaller than the alpha value of 0.05, and the supporting hypothesis is therefore accepted. The leverage ratio, business size, and Return on Assets are all significantly correlated. The leverage ratio is a less significant predictor of company growth, firm size, and return on assets, as shown by the fact that the independent variables collectively accounted for 21.5% of the variation.
Summary findings
From the above results, we have summarized the findings below:
Related Services
Our academic writing and marking services can help you!
Study Resources
Free resources to assist you with your university studies!