
Data Analysis Sample Work
Mental Disorder Prediction using Deep Learning Techniques
Info: 2067 words Sample Data Analysis
Published: 20th DEC 2022
Tagged: Computer Science & IT
After we have used the pre-processing tools on our dataset, we give the pre-processed information to the model so it can be trained. We are attempting to run two alternative models in our study to better comprehend our data and determine whether deep learning algorithms perform better. Long short-term memory (LSTM) and long short-term memory with CNN memory paired with 1-D convolutional neural network are the two techniques under question. The two stages of each model we are training are the embedding layer and the deep learning layer (number of layers required for achieving better model)
Embedding layer
The embedding layer in Keras is one of the layers that can be accessed. This is primarily used in NLP applications like language modeling, while it might potentially be used in other neural network-related tasks. When tackling NLP problems, we might use pre-trained word embedding like Word2Vec. As an alternative, we may train our own embedding using the Keras embedding layer.
The embedding layer that we'll employ comes from the Keras platform; this platform offers an embedding layer that can be applied to our data in text. This embedding layer may need to be trained by the user using textual data, or it may already be trained. Each phrase from our tweets will be embedded as a number in this layer after training because the embedding layer is initially initialized with random weights. Two different embedding layers, such as the Normal embedding layer and the Word2Vec embedding layer, will be used in our investigation (pre- trained embedding layer).
LSTM (Long Short term memory) and CNN (Convolutional Neural Network):
long and short memory Memory Networks, often known as "LSTMs," are a special kind of RNNs that can recognise long-term dependencies. They were first introduced by Hochreiter & Schmidhuber (1997), and several authors continued to refine and popularise them in publications that came after. They are currently in extensive use and work amazingly well when applied to a variety of problems.
Because the LSTM model, when combined with the usage of a convolutional neural networks (CNN), produces accurate results for word classification, it has lately been used in a range of NLP applications. LSTM models use memory cells to maintain the association between words for a longer period of time, whereas CNN models use convolutional and greatest pooling layers to extract the most important information. They are consequently more adept at categorizing text. Long-term dependence is a problem that LSTMs are designed to prevent. It's simply their default behavior to remember things for a very long time rather than working hard to acquire it.
The sigmoid activation functions that make up LSTM gates frequently output 0 or 1. The sigmoid function for gates is used in this strategy because a gate must only output positive values and be able to determine whether to keep or remove a particular characteristic.
The value 0 represents a fully closed gate.
1 indicates that the gates are open and allow for free passage of all things.
How much new data will be related to the input gate is kept in the cell state and are described by the first equation. The second gate instructs the cell state to throw away the data and is referred to as a forget gate. The output gate, which can be used to activate the LSTM block's final output at timestamp 't', is designated as the third.
Description Of Activation Function, Loss Function, Optimizer
A neuron's activation function determines whether or not it ought to have been activated. This indicates that it will determine whether or not the neuron's input to the network is meaningful during the prediction phase using more basic mathematical techniques. The acronym for this phrase is ReLU. The key benefit of using the ReLU function over other activation strategies is that it does not simultaneously activate all of the neurons.
The loss function shows how well your predictive algorithm performs in terms of its ability to anticipate the intended outcome (or value). Given that our goal variable was a binary variable, we selected binary cross entropy..
Instead of stochastic gradient descent, an alternative optimization approach called Adam can be used to train deep learning models. By integrating the best features of the AdaGrad and RMSProp algorithms, Adam develops an optimization strategy that can manage and regulate sparse gradient in noisy settings.
LSTM – CNN
To create a new model, we will combine a one-dimensional convolutional neural network layer and a long short-term memory layer that we will independently develop. The embedding layer sends the 1-D CNN layer outputs to the max pooling layer, where the output gets smaller and picks up only key features before being sent to the following layer. It is decided whether or not the user has a mental health condition by passing the output of a certain max pooling layer to the LSTM and then to the dense layer.
The training and testing sets each had an equal number of tweets that represented persons with mental health issues and those who do not, in order to produce better results. The various models were thoroughly trained to produce the aforementioned hyperparameters. Let's look at the many models that have been trained for this research.
Performance Metric
Since all of the deep learning methods used in our study are for classification, there are specific performance criteria required to evaluate the models that we have trained. We have selected Accuracy, Precision, Recall, and F1 score as our performance measures. Confusion matrix was also taken into consideration to help us understand much more deeply since it shows how much mistake we have in the data we have gathered from modeling.
The precision, recall is also defined as,
Here, FP stands for false positive (positive tuples with the correct labels) and TP stands for true positive (tuples that were supposed to be negative but were really positive)
False negative, or FN (positive tuples that have been mistakenly classified as negative)
The "harmonic mean of the average precision and recall values of the classification," which is also written as,
Overall F 1 score:
The accuracy ratio of disorder prediction is measured by,
Accuracy\left(ACC\right)=Classification\ rate=\frac{TP+TN}{N}\ \ (N=TP+TN+FP+FN)
The false detection ratio or negative predictive value is measured by,
Negative\ predictive\ value(NPV)=\frac{TN}{TN+FN}
The suggested system's performance will be assessed using the aforementioned metrics, and the outcomes will be compared to those obtained using more conventional techniques. Additionally, 10-fold cross-validation will be used in the social networking site to determine whether the classifiers are capable of generalization. The receiver-operating characteristics (ROC) curve will be used to assess the effectiveness of the proposed model. The relationship between specificity (true negatives) and sensitivity (true positives) for each value of the dimension screening scale with regard to differentiating two groups of interest is often measured by the ROC curve.
The entire accuracy of the prediction model is thus correctly represented by the ROC. This is a part of the unit square, hence it will always have a value between 0 and 1. A ROC of 0.5 denotes erratic performance, while one denotes faultless performance. A value of 0.9-1 indicates exceptional predictive accuracy, 0.8-0.9 indicates good accuracy, 0.7-0.8 indicates fair accuracy, 0.6-0.7 indicates bad accuracy, and 0.5-0.6 indicates unacceptable poor accuracy. In this sense, the suggested model will be assessed and contrasted with the conventional approach.
LSTM: An embedding layer and two LSTM layers make up the entire three-layer structure of this model. We improved the accuracy of this model by adding one extra dropout layer to this combo. This model's testing precision is approximately 93.5%. The graph below displays the training and testing models for each epoch.
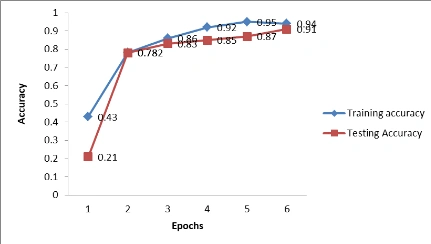
Figure 1: Graph of both training and testing model for each epoch - LSTM
Below is the LOSS Graph for LSTM method.
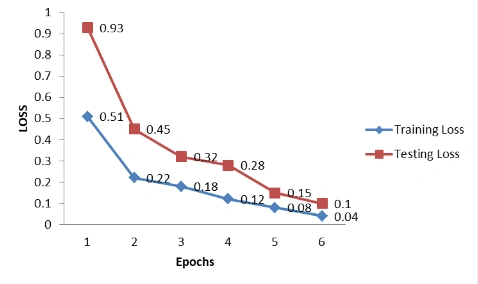
Figure 2: Loss graph
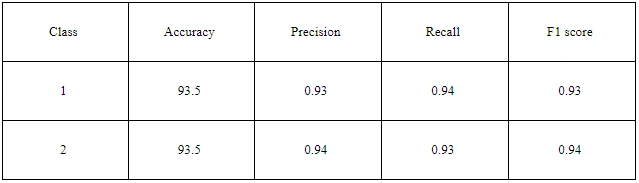
Table 1: Classification report
The precision, recall, and f1-score results showed that they are mainly similar and fall within the range of 93 to 94%; this finding only applies to test data. Let's look at the confusion matrix to confirm the error of the problem.
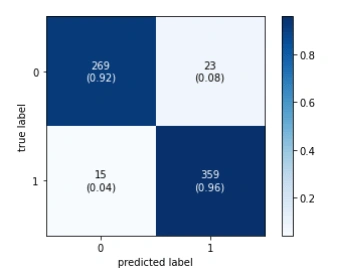
Figure 3: Confusion matrix
For this model, 15 people were incorrectly forecasted as having mental health issues, while 23 users were incorrectly projected as not having such issues.
LSTM-CNN: The five layers that make up this model are the embedding layer, the LSTM layer, the CNN layer, and the Maxpooling layer. In order to flatten the output of the LSTM layer into the length of the binary output form, a dense layer is finally added. This model's testing precision is 99.04%. Let's examine the graph of all epochs' training and testing data.
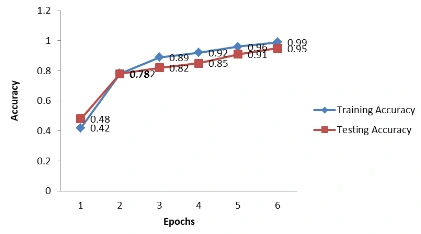
Figure 4: Graph of both training and testing model for Embedding layer + LSTM-CNN
Below is the LOSS Graph for Embedding layer + LSTM-CNN method.
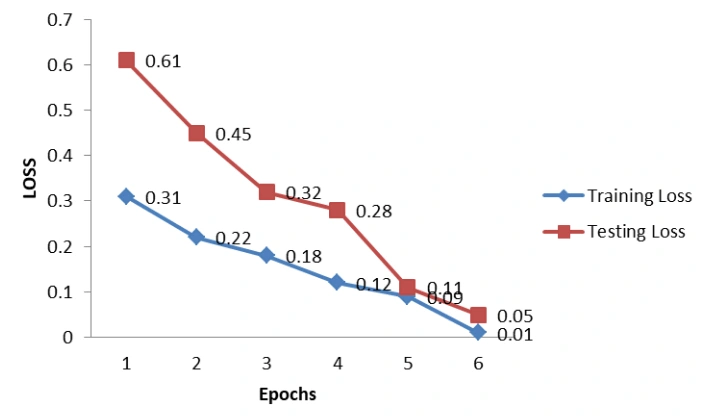
Figure 5: Loss graph
We can see that both the test and training dataset are converging towards the end, if we train with more epochs we might run into over fitting. So, let's see the precision, recall and f1 score now –
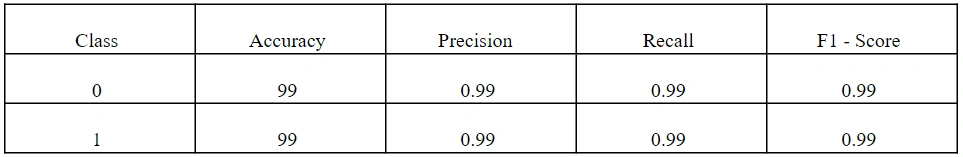
Table 2: Classification report
This is similar as the 1st model, but in the suffering from mental health issue has 99% in all the metrics. Let's look at the confusion matrix to understand where the error occured.
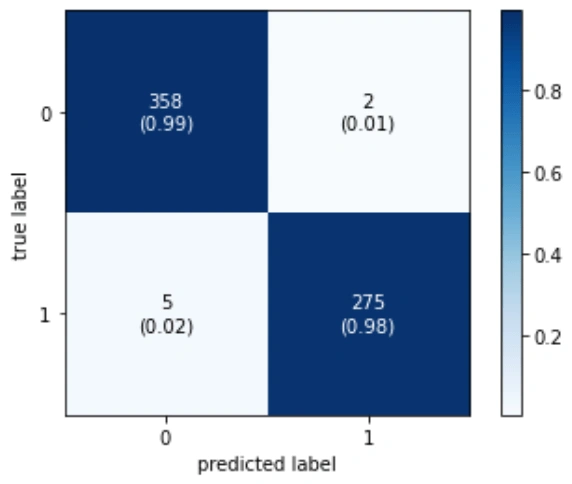
Figure 6: Confusion matrix
We can state with certainty that this model is superior to the first one because it has just 4 users—incorrectly predicted as having mental health issues—and 2 users—who do not.
Word2Vec + LSTM: This model has an embedding model (word2vec vectors) that has already been trained. For this study, we picked a 300-Dimensional vector because it might represent all the words in the dataset we took into consideration. LSM layer is identical to the previous two models. This model's testing precision is 97.92%. Let's examine the accuracy graph for training and testing across all epochs.
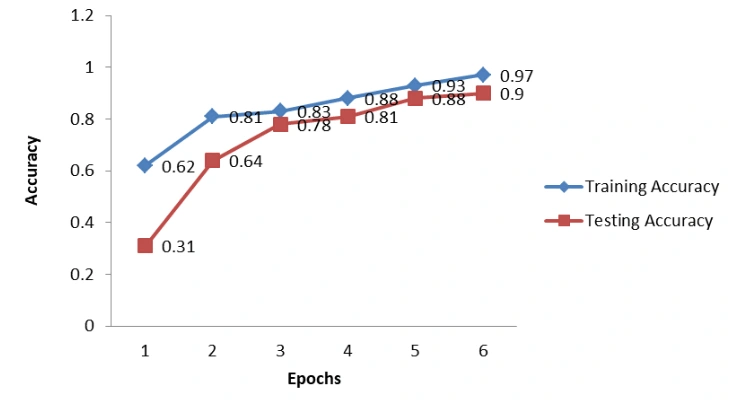
Figure 7: Graph of both training and testing model for Word2Vec + LSTM
Below is the LOSS Graph for Word2Vec + LSTM method.
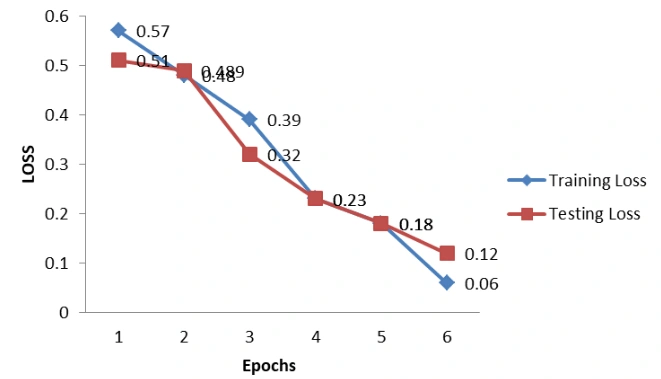
Figure 8: Loss graph
Next continuing that, to mention about Precision, recall and F1-score-
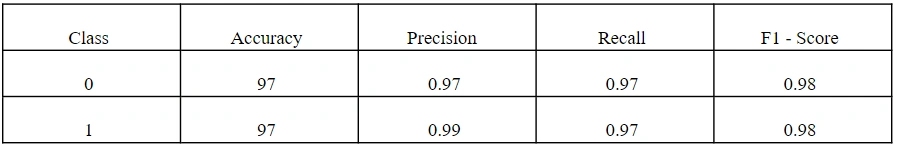
Table 3: Classification report
We can observe from the results above that recall including both the classes have slightly low result compared to the former models, lets see how much error we got using confusion metrics -
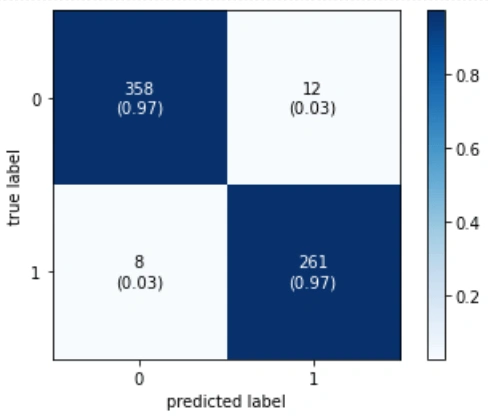
Figure 9: Confusion matrix
The main conclusion we draw from this is that this model has some difficulties understanding who doesn't suffer from mental health issues; 12 people are predicted to be users who do not.
LSTM-CNN with Word2Vec: Word2Vec is the initial layer in this model, followed by a convolutional neural network and maxpooling to extract only the most crucial data, which is then passed on to the LSTM layer. This model's testing accuracy was roughly 98.24%. Take a look at the graph below to see how well this model performs during training and testing.
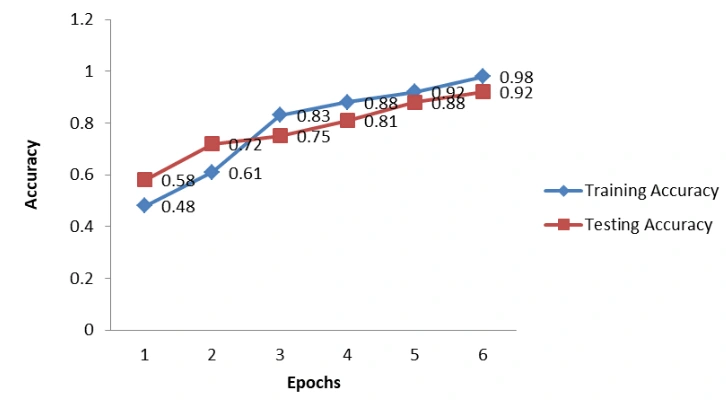
Figure 10: Graph of both training and testing model for Word2Vec + LSTM-CNN
Below is the LOSS Graph for Word2Vec + LSTM-CNN method.
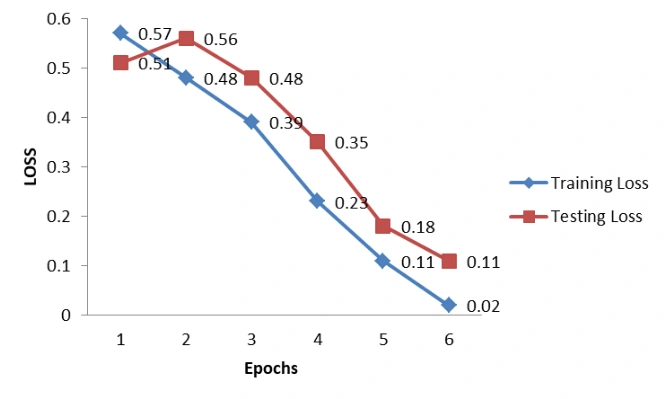
Figure 11: Loss graph
Continuing that, to mention about precision, recall and F1-score-
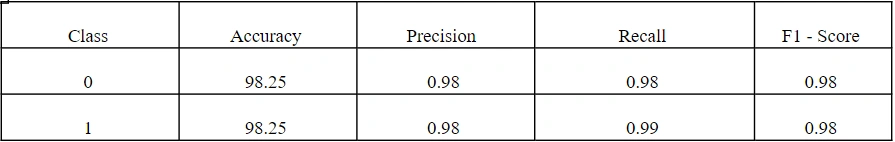
Table 4: Classification report
This is similar as the 2nd model which we have trained, as it has same LSTM-CNN combination. let's see how much error we got using confusion metrics –
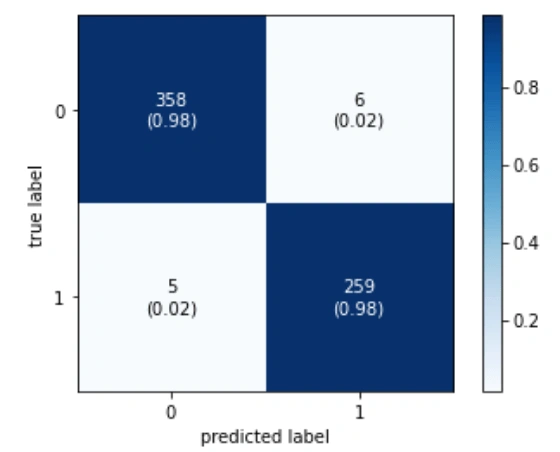
Figure 12: Confusion matrix
For this model, 6 users are wrongly predicted as Suffering from mental health issue and 5 users have been predicted wrongly as not suffering from mental health issue.
The comparison of all the model's accuracy is given below:
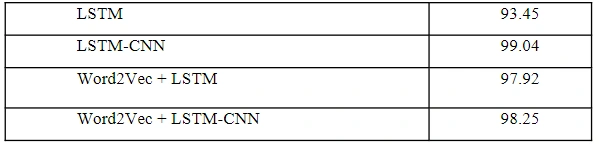
Because tweets frequently contain slang, unusual acronyms, misspellings, internet slang, and other words that may be in the Word2Vec word embedding layers, the accuracy of the Normal embedding layers is better than the pre-trained on average. The LSTM-CNN model embedding layer has marginally outperformed the other models in terms of performance.
Related Services
Our academic writing and marking services can help you!
Study Resources
Free resources to assist you with your university studies!