
Data Analysis Sample Work
Comparison of Operational And Financial Performance of Indian Manufacturing And Service Industries
Info: 2145 words Sample Data Analysis
Published: 02th Dec 2023
Tagged: Finance
Statistical Analysis
The researchers presented the results and analysis of the quantitative data in this chapter. The study used a 400-person sample, and the workers from manufacturing and service companies provided the data. The collected data were first entered into an excel and analysed using the SPSS version 25.0. Frequency tables were evaluated for the demographical variables of the respondents. Finally, the reliability analysis evaluated internal consistencies. Finally, an independent sample t-test was used to compare the groups, and Correlation was used to assess how closely related several things are internal.
Frequency table
Table 4.1 Frequency table for Demographical variables
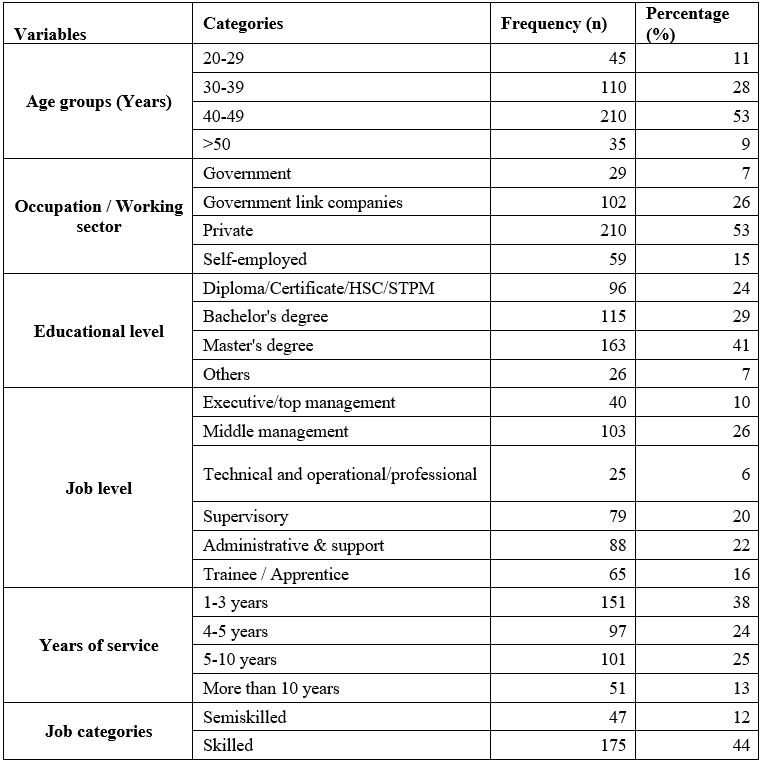
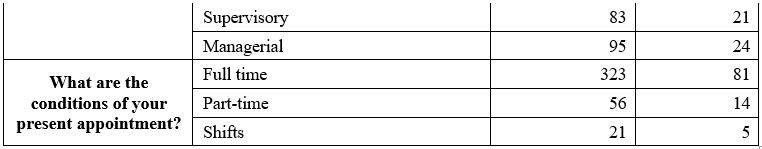
Table 4.1 shows the frequencies of demographical characteristics. These analyses establish that most of the respondents (53%) belong to the 40-49 years age group, followed by 28 percent are 30-39 years age group, 11 percent are 20-29 years old, and finally, 9 per cent being more than 50 years age group. When considering the respondents' occupations, most (53%) are working in private sectors, 26 per cent are working in government link companies, 15 per cent are self-employed, and only 7 per cent are working in government sectors. In the same manner, most of the respondents (41 %) completed a master's degree, while 29 and 24 per cent are completed a bachelor's degree and diploma, respectively.hen considering the job levels of respondents, around 26 percent of respondents' job level is middle management followed by 20 per cent of supervisors, and 16 per cent are trainees/apprentices and soon. Similarly, considering the respondents' experience, most respondents (38%) possess experience between 1 and 3 years, followed by around 25 per cent having experience of 5-10 years, and 24 per cent having experience of 4-5 years. However, only 13 per cent of the respondents have more than 10 years of experience. When considering the job categories of respondents, most (44%) of respondents' job category is skilled, whereas 24% of the respondents belong to the Managerial. In this study, around 81 per cent of full-time workers participated, and only 14 and 5 per cent were part-time and shifted workers, respectively.
Table 4.2 Frequency table about companies' information
Table 4.2 illustrates the frequency table of the general information about the company. In the current study, most of the respondents (73%) who participated were workers above 10 years of age in the industry, while the rest were from less than 10 years of age in the industry. The majority of respondents (37%) work in an industry with 101–150 employees, followed by 20% who work in an industry with 50–100 employees, followed by 16% who work in industries with less than 50 employees and more than 200 workers, respectively. Only 11% of respondents work in an industry with 151-200 employees. Similarly, when considering the years of operation of the industry, most of the respondents are working in the industry where operation years are between 16 and 20 years. When considering the respondents' industry type, most respondents (54%) work in service sector industries, and the rest work in manufacturing industries. Respondent's response concerning ISO 9000 is as follows: most respondents think it is prestige. Most respondents agreed that the following quality management practices are used in their organizations: RGNQA, IMC RBNQA, GPNQA, CII EXIM Bank Award, MBNQA and EFQM
Reliability analysis
Table 4.3 Reliability Analysis for each factor
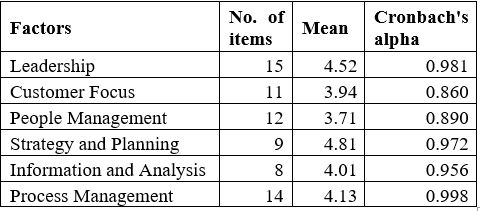
Table 4.3 represents the reliability analysis. The study used reliability analysis for each multi-item scale using Cronbach's alpha. The reliability analysis results and descriptive statistics for each variable were presented in the table. Overall, the study reported strong reliability with coefficient alphas ranging from 0.86 to 0.99, demonstrating that the scale demonstrates good reliability.
Independent sample t-test
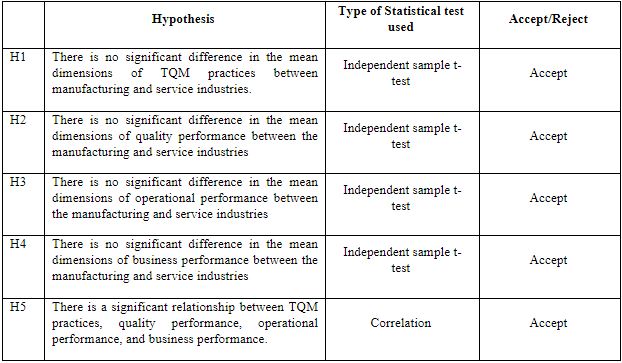
H1: There is no significant difference in the mean dimensions of TQM practices between manufacturing and service industries.
Table 4.4 Comparison between manufacturing and service industries based on the dimensions of TQM practices
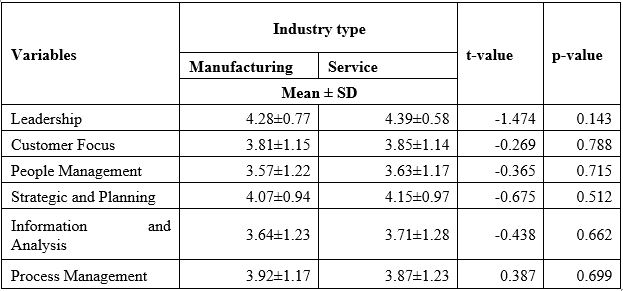
Table 4.4 shows the mean comparison between manufacturing and service industries based on the factors of TQM practices. From the table, the significance value shows that the p- values are greater than 0.05 for all the dimensions of TQM practices. Hence, it was concluded that there is no statistically significant difference between these two industries based on the response concerning TQM practices. In addition, all these factors have a mean value (>3.5) around 4. It indicates that most of the respondents agreed on all the dimensions of TQM practices. Finally, the null hypothesis was accepted and concluded as,
Hypothesis (H1): "There is no significant difference between Manufacturing and Service industries of TQM dimensions".
H2: There is no significant difference in the mean dimensions of operational performance between manufacturing and service industries.
Table 4.5: Comparison between manufacturing and service industries based on operational performance
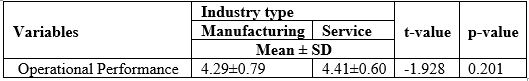
Table 4.5 shows the mean comparison between manufacturing and service industries based on the factor of operational performance. From the table, the significance value shows that the p-value is greater than 0.05(p (0.201) >0.05) since it was stated that there is no statistically significant difference between these two industries based on the response concerning operational performance. In addition, these factors have a mean value (>3.5) around 4. It indicates that most of the respondents agreed with operational performance. Hence, the null hypothesis was accepted and concluded as,
H2: There is no significant difference in the mean dimensions of operational performance between manufacturing and service industries.
H3: There is no significant difference in the mean dimensions of business performance between manufacturing and service industries.
Table 4.6: Comparison between manufacturing and service industries based on business performance
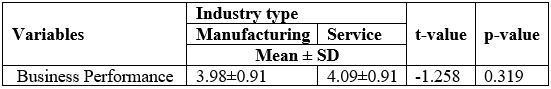
Table 4.6 shows the mean comparison between manufacturing and service industries based on the business performance factor. From the table, the significance value shows that the p-value is greater than 0.05(p (0.319) >0.05) since it was stated that there is no statistically significant difference between these two industries based on the response about business performance. In addition, these factors have a mean value (>3.5) around 4. It indicates that most of the respondents agreed with business performance. Hence, the null hypothesis was accepted and concluded as,
H3: There is no significant difference in the mean dimensions of business performance between manufacturing and service industries.
H4: There is no significant difference in the mean dimensions of quality performance between manufacturing and service industries.
Table 4.7: Comparison between manufacturing and service industries based on quality performance
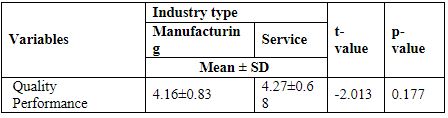
Table 4.7 shows the mean comparison between manufacturing and service industries based on the factor of quality performance. From the table, the significance value shows that the p-value is greater than 0.05(p (0.0.177) >0.05) since it was stated that there is no statistically significant difference between these two industries based on the response about quality performance. In addition, these factors have a mean value (>3.5) around 4. It indicates that most of the respondents agreed with quality performance. Hence, the null hypothesis was accepted and concluded as,
H4: There is no significant difference in the mean dimensions of quality performance between manufacturing and service industries.
Correlation
H5: There is a significant relationship between TQM practices, quality performance, operational performance, and business performance.
Table 4.8 Correlation between the dimensions of TQM practices, Quality performance, Operational performance, and Business Performance
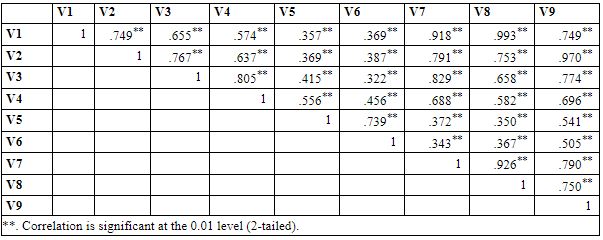
Where V1= Leadership, V2= Strategic and Planning, V3= Customer Focus, V4= Information and Analysis, V5= People Management, V6= Process Management, V7= Quality Performance, V8= Operational Performance, and V9= Business Performance.
Table 4.8 presents the correlation analysis between the dimensions of TQM practices, quality performance, operational performance and business performance. From the table, it is evident that all the factors had a significant relationship with one another, and those factors were positively correlated. This means that as one variable increases in value, another variable also increases in value and vice versa. The amount of relationship value ranges from 0.322 to 0.993. Hence, it was concluded,
H5: There is a significant relationship between TQM practices, quality performance, operational performance, and business performance.
Table 4.9 Summary of the findings
Conclusion
There is no statistically significant difference between these two industries based on the response about TQM practices. In addition, all these factors have a mean value (>3.5) around 4. It indicates that most of the respondents agreed on all the dimensions of TQM practices. There is no statistically significant difference between these two industries based on the response about quality performance. In addition, these factors have a mean value (>3.5) around 4. It indicates that the majority of the respondents agreed with quality performance. There is no statistically significant difference between these two industries based on the response about operational performance. In addition, these factors have a mean value (>3.5) around 4. It indicates that the majority of the respondents agreed with operational performance. There is no statistically significant difference between these two industries based on the response concerning business performance. In addition, all these factors have a mean value (>3.5) around 4. It indicates that the majority of the respondents agreed with business performance. The Correlation shows that all those factors had a positive linear relationship. This means that as one variable increases in value, another variable also increases in value. The amount of relationship value ranges from 0.322 to 0.993.
Related Services
Our academic writing and marking services can help you!
Study Resources
Free resources to assist you with your university studies!