
From Confusion to Clarity: Performing CFA in SPSS AMOS for Your Dissertation or Thesis
- Home
- Academy
- Guideliness
- From Confusion to Clarity: performing CFA in SPSS AMOS for your Dissertation or thesis
Principles for Reporting of Statistical Methods
- 2. Assumptions and Requirements Before You Begin
- 3. Understanding Key CFA Concepts (with Layman Examples)
- 4. Step-by-Step CFA guide
- 5. How to interpret CFA results in SPSS AMOS?
- 6: Common CFA mistakes and How to Fix Them
- 7. CFA Conceptual Clarity – Do You Really Understand Your Model?
- 8. CFA for Thesis/Dissertation – Reporting & Best Practices
- 9. Conclusion
- 10. Reference

Recent Post
Introduction
Confirmatory Factor Analysis (CFA) is an important statistical technique for hypothesis-testing involving the relationships of latent (unobserved) to measured variables. CFA For PhD students and researchers developing dissertations/theses, is a crucial methodological step, which sometimes appears confused. Many students do not fully grasp the differences of Exploratory Factor Analysis (EFA) and CFA, do not understand the meaning of the model fit indices interpretation, or are simply frustrated with AMOS errors. When employing CFA as a statistical tool, the point is to validate/confirm a theoretical mode. This article will provide SPSS AMOS CFA tutorial in a way that is conceptually useful and practically applicable for a dissertation or thesis (Kline, 2023; West et al., 2023).
- CFA is ultimately a hypothesis-driven method of factor analysis used to determine how well a set of observed variables (questions, test items, etc.) represents a group of underlying latent variables (constructs, e.g., satisfaction, motivation, or intelligence). EFA is a method used when you explore data to discover how many factors the data reveals within these observed variables; CFA uses data to confirm if the theorized relationships between factors and observed variables are correct (Widaman & Helm, 2023).
- The largest difference between CFA and EFA is purpose. In EFA, we don’t know how many factors the data has; the number of factors is derived from the data. CFA is only applied when you have a model (theory). You want to determine if the data fits the model. CFA is typically used to test theories or confirm previous research, while EFA is used to find patterns in the data (Bhale, 2024; Hoyle & Gottfredson, 2023).
- CFA is particularly popular in psychology, social sciences and health research to study unobservable constructs, such as attitude, personality traits, and perceptions. For example, we have used CFA to determine if researchers can accurately measure the concept of “job satisfaction”, or “academic motivation” using a set of survey items. The survey items may have had questions on them, but the constructs are not measurable (Hashemi et al., 2024).
2. Assumptions and Requirements Before You Begin
Before you begin the CFA process, it’s essential to make sure that your data meets certain assumptions. These CFA assumptions are vital to achieve reliable and valid findings from CFA (Kline, 2023; West et al., 2023).
Sample size
A primary consideration of sample size issues is that a large sample size leads to increased reliability of the factor estimates and given that CFA typically requires larger sample sizes to achieve a high level of power. Aim for a minimum of about 200 cases so that you have a sample size sufficient for reasonably good parameter estimation (Kline, 2023).
Normality
Another assumption of CFA is that the observed variables have an approximately normal distribution. If your data are materially nonnormal, then transformation or some other method may be required (Kanchanawongpaisan & Pamungkas, 2025).
Linearity
Your models must involve linear relationships. If some relationships are non-linear, CFA may not be an appropriate analysis to perform; for example, alternative approaches (Sterner et al., 2024).
No Multicollinearity
While high correlations between observed variables yield substantial loadings, too much correlation can create multicollinearity, causing unstable parameter estimates. Multicollinearity can also be checked through correlation matrices or Variance Inflation Factors (VIF) (Kunicki et al., 2023).
Theory-Driven Measurement Model
While EFA is a purely data-driven procedure, CFA is a theory-driven one. You should have an idea of how and which latent variables represent the observed variables prior to performing CFA (Bhale, 2024).
3. Understanding Key CFA Concepts (with Layman Examples)
Before running CFA, it’s crucial to understand the underlying concepts. Let’s explore these concepts with simple examples.
Latent Variables vs Observed Variables
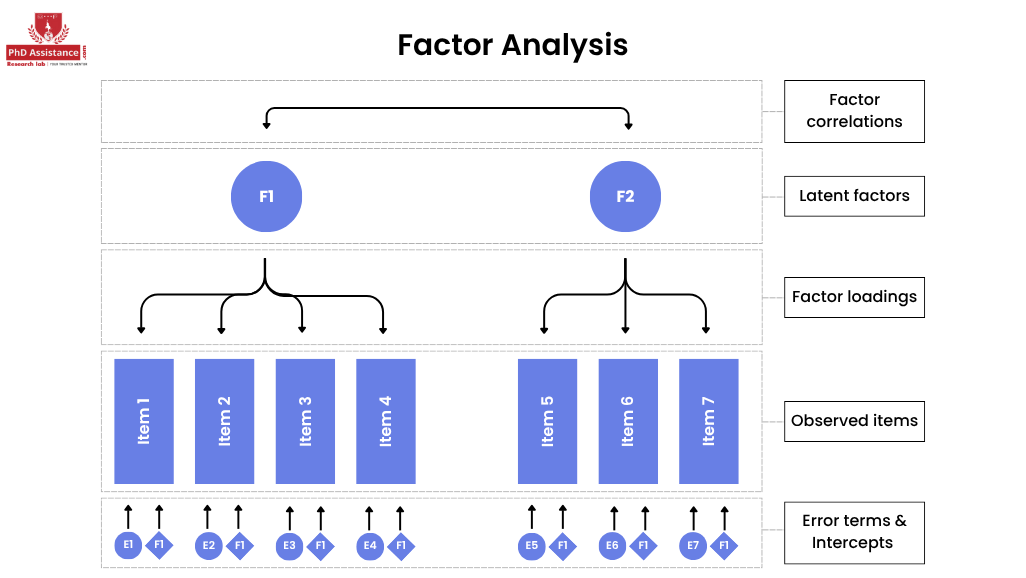
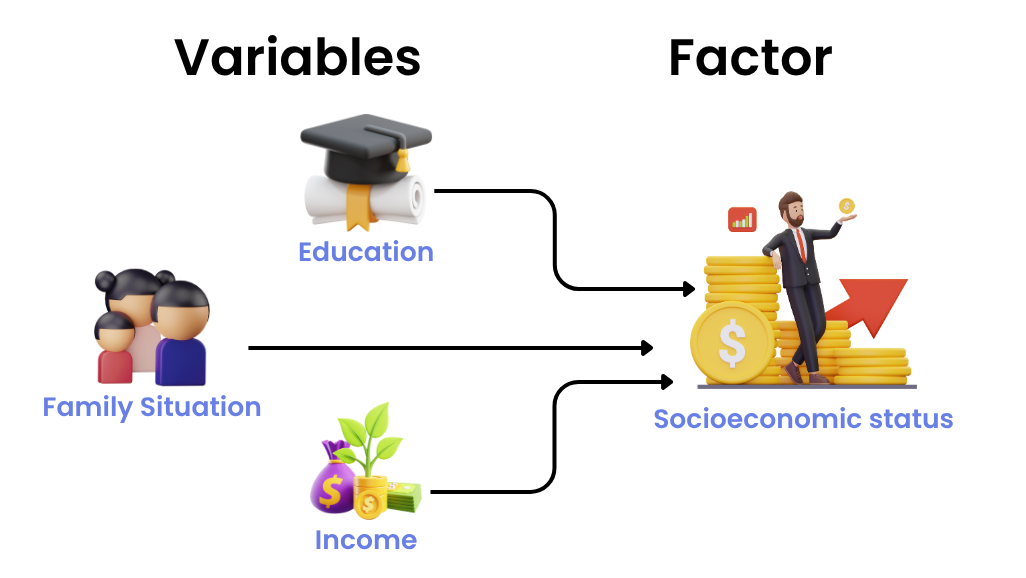
Latent variables are abstract concepts, such as “self-esteem” or “job satisfaction,” which cannot be measured directly. Observed variables, on the other hand, are the actual survey questions or test items that represent these constructs (West et al., 2023).
Factor Loadings
Factor loadings represent the strength of the relationship between an observed variable and the latent factor it measures. Higher loadings suggest that the observed variable is a better representation of the latent factor (Kline, 2023).
Path Diagrams
Path diagrams visually represent the relationships between observed and latent variables. The arrows in a path diagram indicate the direction of causality or association, and the thickness of the arrows often reflects the strength of the relationship (Kunicki et al., 2023).
Measurement Error
Measurement error is the difference between the true value of a latent variable and what is measured by the observed variable. In CFA, we account for this error by estimating the error term for each observed variable (Kline, 2023).
Model Identification
A CFA model is identified when there are enough data points to estimate all the parameters (factor loadings, variances, etc.). If your model is under-identified, you may encounter problems such as negative error variances or non-convergence during analysis (West et al., 2023).
4. Step-by-Step CFA guide
Step I: Prepare Your Data in SPSS
Begin by cleaning your data. Look for missing data and outliers, then double-check to ensure your variables are all coded correctly. For CFA, observed variables must be at least ordinal (Bhale, 2024).
Step II: Open AMOS and Draw Your Model
In AMOS, to make your path diagram, you will drag both latent variables and observed variables to the workspace. Then use the arrows to show the relationship between the observed variables and their latent variables. Make sure you defined all residual variances for the observed variables and the variances and covariances for the latent variables (Sterner et al., 2024).
Step III: Variables and Parameters
Next you can start defining the nomenclature (e.g. “Job Satisfaction”, “Work Performance”) and indicating the measurement scale. You will also need to define parameters/bound values for the corresponding factor loadings, variance and covariance (Kline, 2023).
Step IV: Conduct analysis and troubleshoot errors
After you run the model, watch for errors such as model is not identified or convergence issues. We want to ensure that you do not have overly restrictive constraints, or a small sample size does not affect your results (West et al., 2023).
Step V: Assess fit indices
Next, we will assess your pertinent fit indices: Chi-Square, CFI, RMSEA, and SRMR. Each fit index gives some indication on how well your model fits your data (Kline, 2023).
5. How to interpret CFA results in SPSS AMOS?
Interpreting CFA results can be somewhat complicated, but it becomes simpler when you pay attention to a few indices.
Chi-Square (χ²): A non-significant chi-square indicates that your model fits well, but it is sensitive to sample size. In large samples, even a small difference between the observed covariance and the expected covariance can lead to a large chi-square value (Kline, 2023).
CFI (Comparative Fit Index): The closer to 1.0, the stronger the fit … Although it’s recommended that a CFI be 0.90 or larger (West et al., 2023).
RMSEA (Root Mean Square Error of Approximation): This measures the error in approximation. In general, RMSEA below 0.08 indicates a good fit, with values closer to 0.05 indicating an excellent fit (West et al., 2023).
SRMR (Standardized Root Mean Residual): the SRMR is a measure of the average residual (the difference between the observed covariances and predicted covariances). An SRMR below 0.08 is considered a good model (West et al., 2023).
6: Common CFA mistakes and How to Fix Them
Model Not Identified
This problem arises when the number of parameters exceeds the number of data points. Make sure your model is theoretically sound and that you have plenty of data to estimate every parameter you need. (Kline, 2023).
Bad Fit
If the fit of your model is bad, you might consider restructuring your model. Look for ways to adjust paths or allow for error covariance between observed variables but again, do this based on your theory and not just on modification indices (Sterner et al., 2024).
Negative Error Variances
Negative error variances show that there is an issue with model specification. Revisit your relationships amongst variables and ensure your model is in good order (Bhale, 2024).
Modification Indices
Be careful as you use modification indices. Modification indices may provide you with suggestions to repair the model, but ensure modifications are driven by your theory as opposed to just being data-driven suggestions (Sterner et al., 2024).
7. CFA Conceptual Clarity – Do You Really Understand Your Model?
The key component of CFA is not just fitting but understanding the point of the model. What you don’t want to do is overfit the data by having too many parameters in the model that will fit the data perfectly but will not generalize well (Kline, 2023). On the other hand, you can under fit the data, if your model is too simplistic, by not allowing the model to capture the relationships in the data (Kline, 2023).
8. CFA for Thesis/Dissertation – Reporting & Best Practices
When you report your CFA results in your dissertation or thesis be direct and clear about your reporting. Report your statistics in line with APA style i.e. provide your statistics like chi-square, CFI, RMSEA, and SRMR. Provide a visual path diagram for your model and describe the theoretical justification for the model and any modifications made to the model during your analysis (Kline, 2023; Widaman & Helm, 2023).
Conclusion
CFA can feel daunting, however, if you know the concepts, assumptions, and steps, you will feel ready to apply CFA to your own dissertation or thesis. CFA in SPSS AMOS can be an effective way to validate your constructs. Significant testing of previously established theories or simply confirming your modelling with CFA can provide assurance for your research results. The key is to understand that the objective is not just getting numbers right, but ensuring your model is accurately testing the theoretical relationships that you are interested in as stated in an earlier chapter.
- Need Professional Help with conducting confirmatory factor analysis for Your Research Work? Our experts provide excellent support in model for and data interpretation.
- Contact us today to ensure that your study complies with the best statistical reporting practices to enhance the credibility and reproducibility of your research to successfully publish your work!
References
- Bhale, U. (2024). Handbook for Beginners on Structural Equation Model (SEM). Available at SSRN 4787950.
- Hashemi, N., Mirbaha, B., Abdi Kordani, A., & Hosseinian, S. M. (2024). Modeling Airline Choice Behavior Based on Observed and Latent Variables Using Structural Equation Modeling and Multinomial Logit-Factor Analysis Hybrid Approach. Iranian Journal of Science and Technology, Transactions of Civil Engineering, 1-19.
- Hoyle, R. H., & Gottfredson, N. C. (2023). Structural equation modeling with latent variables.
- Kanchanawongpaisan, S., & Pamungkas, T. (2025). DECODING SYMBOLISM IN STATISTICAL MODELING: AN EXPLORATION OF STRUCTURAL EQUATION MODELING AND DESCRIPTIVE ANALYSIS. INTERNATIONAL JOURNAL OF EDUCATIONAL MANAGEMENT, 1(1), 17-24.
- Kline, R. B. (2023). Principles and practice of structural equation modeling. Guilford publications.
- Kunicki, Z. J., Smith, M. L., & Murray, E. J. (2023). A primer on structural equation model diagrams and directed acyclic graphs: When and how to use each in psychological and epidemiological research. Advances in Methods and Practices in Psychological Science, 6(2), 25152459231156085.
- Sterner, P., Pargent, F., Deffner, D., & Goretzko, D. (2024). A causal framework for the comparability of latent variables. Structural Equation Modeling: A Multidisciplinary Journal, 31(5), 747-758.
- West, S. G., Wu, W., McNeish, D., & Savord, A. (2023). Model fit in structural equation modeling. Handbook of structural equation modeling, 2, 184-205.
- Widaman, K. F., & Helm, J. L. (2023). Exploratory factor analysis and confirmatory factor analysis.