
Data Analysis Sample Work
An Evaluation of Student Retention in U.S. Higher Education: Attrition Trends and Entry Grades
Info: 2347 words Sample Data Analysis Analysis
Published: 10th Mar 2023
Tagged: Business Management
Introduction:
This chapter describes the data and the analysis of the collected data. Because they were the most useful for reaching the study's objective, quantitative data were chosen for it. Because such national data can only be gathered and made available through federal authorities, secondary data has been utilized. The National Centre for Education Statistics was used to collect the data (NCES). Only the groupings of part-time and full-time undergraduate students who are young and mature are covered by the data presented. Young and older full-time undergraduate applicants span five time periods from (2016-17 to 2020-2021) for each age group. The data gathered include full-time and part-time students, first-year students, personal traits, and non-continuation after the admissions year. Those who withdraw from the following academic year are part-time first-degree applicants younger than 30 and not mature students. The information relates to first-degree undergraduate full-time entrants. Results are presented throughout four figures, one for each period 2016–17 to 2020–21, to allow for accurate and direct comparison while considering changes in statistical methodologies, categories, and in some cases, language. Young full-time first-degree applicants and mature students are the two student divisions for whom results are shown. After entering the data into an excel spreadsheet, SPSS 25.0 was used to analyze it. For each category, descriptive data and a frequency table were computed. The association between the variables was discovered using Correlation. For the diagrammatic representation of the data, a bar chart was employed.
Hypothesis:
H01: There is no relationship between entry grades and attrition trends.
H11: There is a relationship between entry grades and attrition trends.
Only publications that are empirical and match the current research topic will be considered after being found and confirming their reliability and validity. This research will mostly contain papers that address attrition, student retention, and admission grades. Only occasionally will other educational documents be used. The value proposition, in this case, will be the inclusion of empirical articles that will be crucial in boosting this research's reputation and validating its findings simultaneously.
Table 1: Descriptive statistics for higher education students for Full time and Part-time students
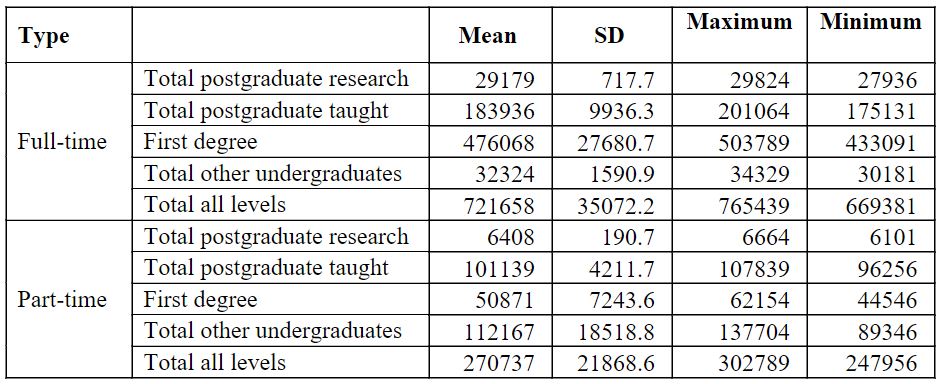
Table 1 represents the descriptive statistics for higher education students for part-time and full-time students. The data were gathered based on the same categories used to classify part-time and full-time students: total undergraduates, total graduate students, total postdocs, total postdocs who are teaching, total first-year students, and total all levels. Descriptive statistics with mean, standard deviation, minimum and maximum are included in the table. For full-time First degree, they had the highest mean and S.D. value of 476068 ± 27680.7 with a maximum weight of 503789 and a minimum value of 433091. While considering the part-time, total other undergraduates contain the highest mean and S.D. value of 112167 ± 18518.8 with a maximum weight of 137704 and a minimum value of 89346.
Table 2: Descriptive statistics for the enrolments in higher education for First Year/First Degree Full-Time and Part-Time Students by Personal Characteristics
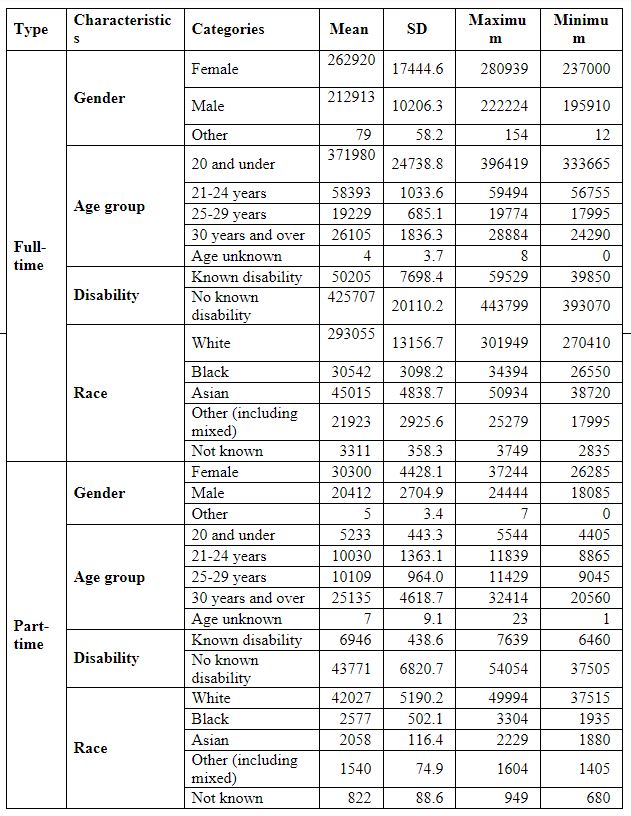
Table 2 represents the descriptive statistics for enrolments in higher education for First Year/First Degree Full-Time and Part-Time Students by Personal Characteristics. Part-time and full-time comprise the following characteristics of Gender, age group, Disability and Race. For full-time, Females had the highest mean value of 262920 ± 17444.6; for the age group, the mean was highest for the group of 20 and under, 371980 ± 24738.8 and for disability, no known disability has the highest standard of 425707 ± 20110.2, and finally for Race White had the highest mean value of 293055 ± 13156.7. While considering the Part-time, Females had the highest mean of 30300 ± 4428.1; for evaluating the age group 30 years and over had the highest standard of 25135 ± 4618.7 for disability, no known disability had the highest mean of 43771 ± 6820.7 and finally considering the Race White had the highest mean of 42027 ± 5190.2.
Table 3: Correlation between total undergraduates, total graduate students, total postdocs, total postdocs who teach, total first-year students, and total all levels.
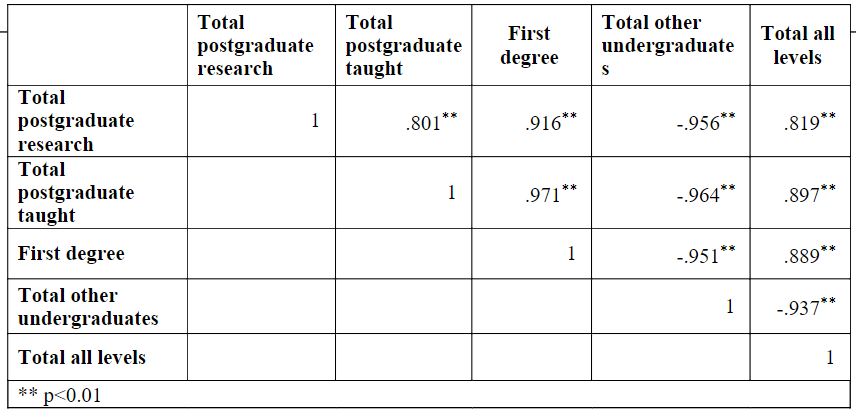
Table 3 represents the Correlation between the total undergraduates, total graduate students, total postdocs, total postdocs who teach, total first-year students, and total all levels. Since the p-value was less than 0.01 for all cases, After ruling out the null hypothesis, it was determined that there is a substantial difference among total undergraduates, total graduate students, total postdocs, total postdocs who are teaching, total first-year students, and total all levels. Then, Total postgraduate taught had significant differences with all levels, including undergraduate and graduate degrees. When comparing the First grade to the Total other undergraduate and the Total all levels, the First grade had differences, and the Total other undergraduate had significant differences from the Total all levels. In several instances, there was a negative correlation between them, including total postgraduate research with total other graduates, total postgraduate teaching with total other undergraduates, first degree with total other undergraduates, and lastly, total other graduates with total all levels.
Table 4: Wilcoxon W test to compare the mean rank of all postgraduate research, all postgraduate taught, first degree, all other undergraduates, and all levels between full-time and part-time students.
Table 4 shows the Wilcoxon W test was used to compare the mean rank of all postgraduate research, all postgraduate taught, first degree, all other undergraduates, and all levels between full-time and part-time students. Because in each case, the p-value was less than 0.01 (p (0.007) 0.01). As a result, the null hypothesis was disproved. However, it was discovered that there is a considerable difference between full-time and part-time students in the mean rank of all postgraduate study, all postdoctoral teaching, first degree, all other undergraduates, and all levels.
Table 5: Full-time undergraduate applicants to Young who do not continue in the next academic year.
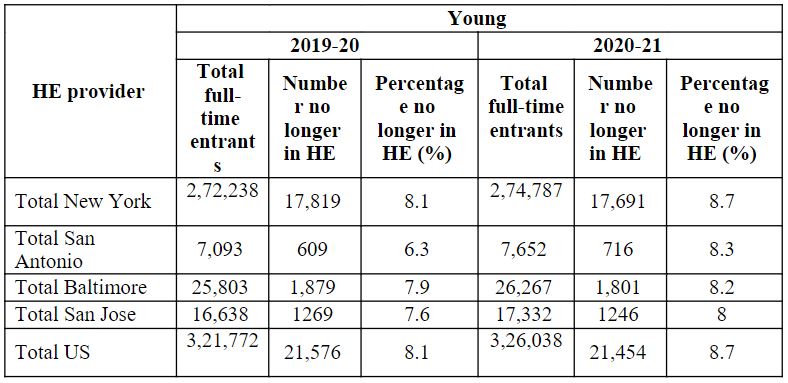
Table 5 shows Young's non-continuation among full-time undergraduate entrants the year after entry. For the academic years 2019–20 and 2020–21, the higher education provider for Total New York, Total San Antonio, Total Baltimore, Total San Jose, and Total U.S. has provided the total number of full-time entrants, number of those longer in HE, and percentage not longer in HE (%).
Figure 1: Full-time undergraduate applicants to Young who do not continue in the next academic year.
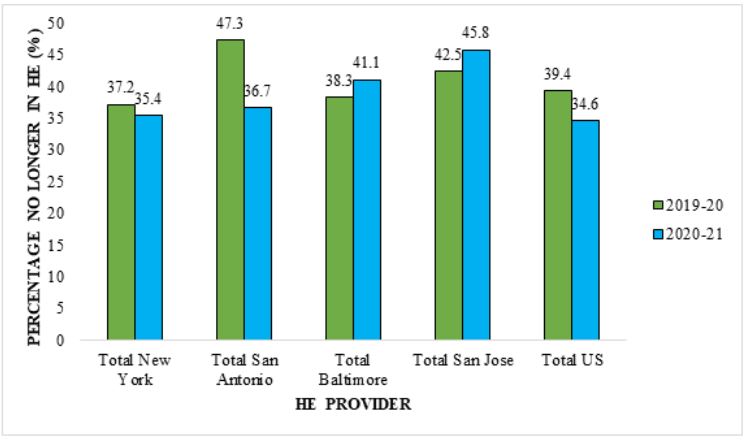
Table 6: Full-time undergraduate applicants for Mature who do not continue in the next year of entrance.
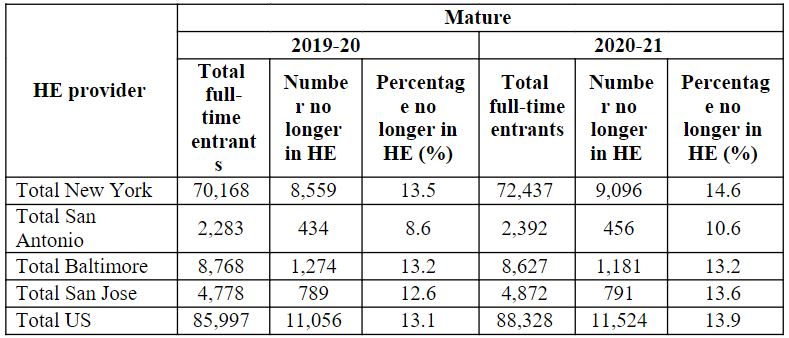
For full-time undergraduate entrants for Mature, Table 6 shows the non-continuation the year after entry. The table shows the total number of full-time enrollees for the academic years 2019–20 and 2020–21 for Total New York, Total San Antonio, Total Baltimore, Total San Jose, and Total U.S., as well as the number of those who have completed more than one academic year and the percentage of those who have completed no more than one academic year.
Figure 2: Full-time undergraduate applicants for Mature who do not continue in the next year of entrance.
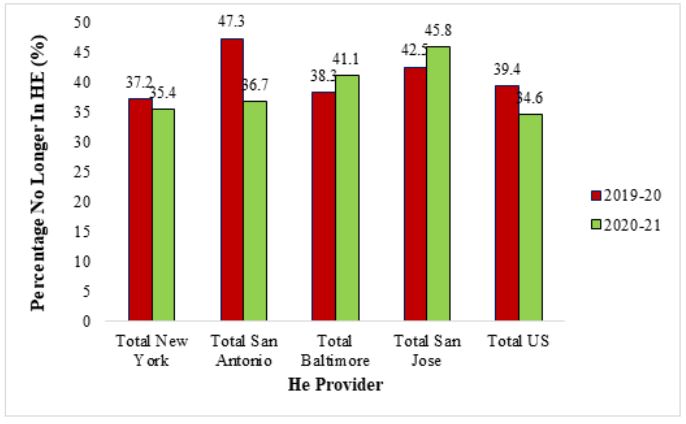
Table 7: Part-time first-degree applicants for those under 30 who entered the next year are not permitted to continue.
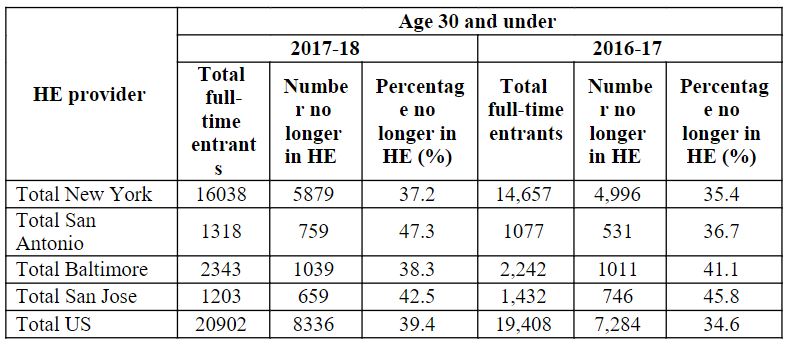
Full-time undergraduate applicants aged 30 and younger who did not continue their studies the following year are shown in Table 7. The table shows the total number of full-time enrollees, the number of those still in higher education, and the percentage of those no longer in higher education (%) for the academic years 2017–18 and 2016–17 for Total New York, Total San Antonio, Total Baltimore, Total San Jose, and Total U.S.
Figure 3: Part-time first-degree applicants for those under 30 who entered the next year are not permitted to continue.
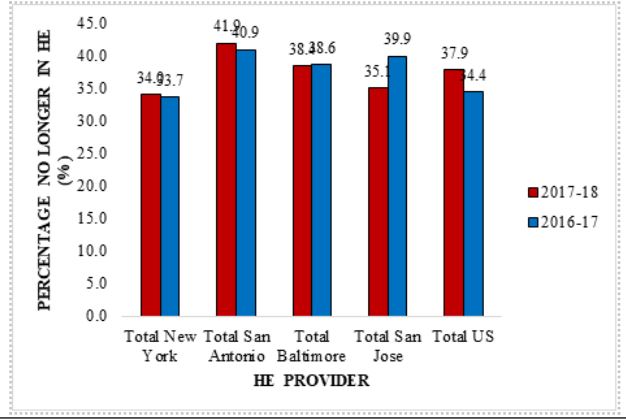
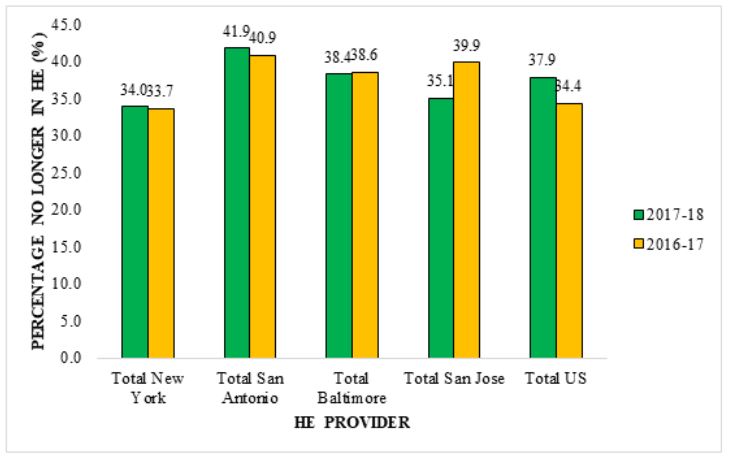
Table 8: Non-continuation in the year after entry for part-time first-degree applicants above 30.
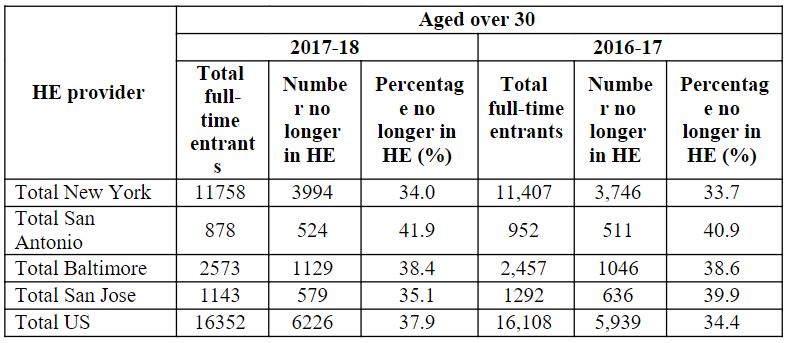
Full-time undergraduate applicants over 30 who did not continue their studies the following year are shown in Table 8 as non-continuation. The table shows the total number of full-time enrollees, the number of those still in higher education, and the percentage of those no longer in higher education (%) for the academic years 2017–18 and 2016–17 for Total New York, Total San Antonio, Total Baltimore, Total San Jose, and Total U.S.
Figure 4: Non-continuation in the year after entry for part-time first-degree applicants above 30.
Summary:
The results show a clear relationship between admission grades and dropout rates. For example, attrition rates have been reported to be less than 2% for students who enter higher education with more than 481 tariff points. The percentage of students who drop out of school has been estimated at 6% for students who enrol in higher education with about 250 tariff points—three times as likely for these students to do so. Students who enter higher education with less than 100 tariff points are six times more likely to depart, with an attrition rate of 12%. These conclusions were seen to be the same and consistent over the course of five years.
The pattern that emerges when comparing the category of young students to the analogous group of older students appears to be pretty much like the percentage of dropouts annually and over five years. This dropout rate seems to be a little inconsistent for older pupils. The figures on dropout rates among older students demonstrate that the impact of their primary education on retention is of relatively low significance. For instance, distinct tariff point groups crucial to attrition are noticeably higher and less consistent every year when comparing the group of students defined as young to those classed as mature. Furthermore, a higher percentage of senior students have been seen to withdraw from higher education courses, which shows that adult students face unique challenges in higher education. These issues are unrelated to their entry-level academic performance.
Related Services
Our academic writing and marking services can help you!
Study Resources
Free resources to assist you with your university studies!