
Data Analysis Sample Work
Analysing the Electrolyte levels in Bangladesh's Intensive Care Unit's Post-Cardiac Surgery Patients
Info: 1962 words Sample Quantitative Analysis
Published: 10th JAN 2023
Tagged: Medicine & Healthcare
Introduction
The study aimed to analyse the electrolyte levels in patients recovering from heart surgery. It was a case-control investigation. In Bangladesh's intensive care unit, the study was being done. A total of 150 patients, including 75 cases and 75 controls, were enrolled in the study. The ICU unit of the heart hospital in Bangladesh was used to identify the cases. The Bangladesh Cardiac Hospital's other departments were used to choose the control. Patients of various sexes and age ranges are addressed. The acquired information was manually entered into excel and then transferred to SPSS statistical software version 25.0. The mean and standard deviation (mean ± SD) were calculated for all variables. Percentage analysis was conducted to determine the respondents' demographic data, and descriptive statistical analysis was also performed for each variable. Chi-square analysis was used to determine the correlations between categorical variables. By modelling the relationship between one or more independent and dependent variables, logistic regression enables us to assess the model's fit and the significance of the relationship between the variables.
Table 5.1: Frequency for Demographical variables of the patients
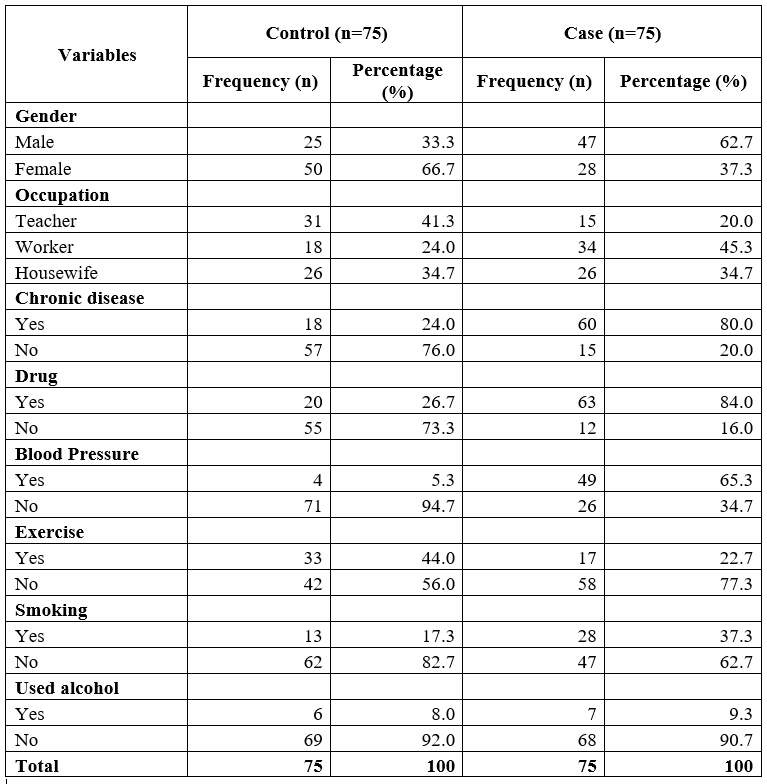
Table 5.1 represents demonstrates the frequency and percentage of the demographical variables. When considering the control group, the majority, 66.7% of the patients, were female, while 33.3% were male. Regarding the case group, 62.7% of the patients were male, while 37.3% were male. When considering the control group, 41.3% of the patients were teachers, followed by 34.7% of the patients were homemakers, and 24.0% of the participants were workers. Regarding the case group, 45.3% of the patients were workers, 34.7% of the patients were homemakers, and 20.0% of the participants were Teachers. Regarding the control group, 76.0% of the patients don't have chronic disease while 24.0% have a chronic illness. When the case group was considered, the majority, 80.0% of the patients, had a chronic condition, while 20.0% of the patients didn't have a chronic illness.
When considering the control group, the majority, 73.3% of the patients, did not use drugs, while 26.7% of the patients used drugs. When the case group was considered, the majority, 84.0% of the patients, used the drug, while 16.0% did not. When considering the control group, the majority, 94.7% of the patients don't have blood pressure, while 5.3% of the patients have blood pressure. When the case group was considered, the majority, 65.3%, of the patients had blood pressure, while 34.7% of the patients didn't have blood pressure. When considered the control group, 56.0% of the patients did not exercise while 44.0% exercised. When the case group is considered, the majority, 77.3% of the patients, did not exercise, while 22.7% of the patients exercised.
When considering the control group, 82.7% of the patients were not smoking, while 17.3% of the patients smoked. When the case group was considered, 62.7% of the patients were not smoking while 37.3% were smoking. When considering the control group, 92.0% of the patients were not use alcohol, while 8.0% of the patients used alcohol. When the case group is considered, the majority, 90.7% of the patients, were not alcoholics, while 9.3% of the patients were alcoholics.
Table 5.2 Frequency of type of surgery
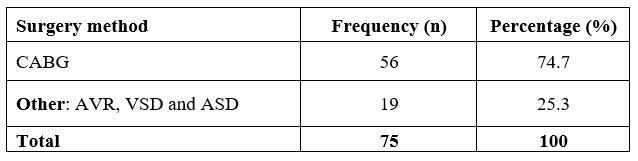
Table 5.2 represents the frequency of surgery methods for the case group; from the table, 74.7% of the patients underwent the CABG surgery, while 25.3% of the patients underwent other procedures like AVR, VSD and ASD.
Figure 5.1.1: Bar chart for the type of surgery
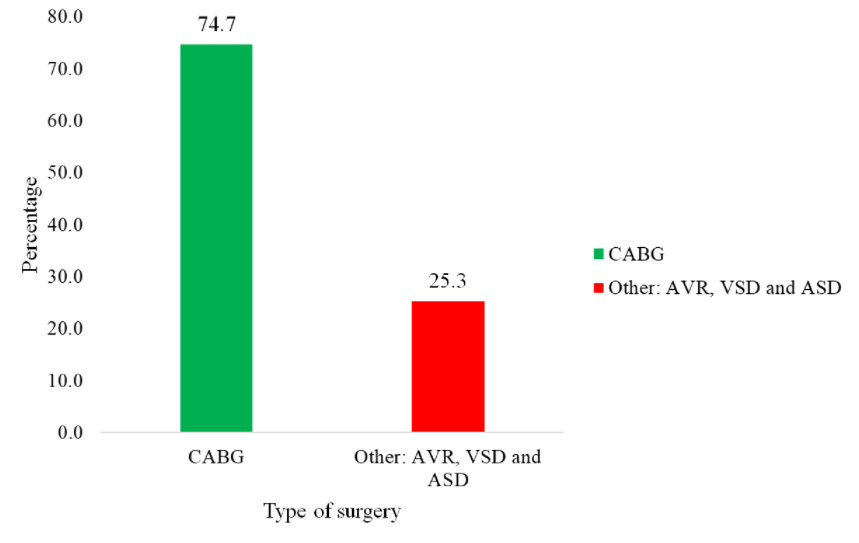
Figure 5.1.1 the diagrammatic representation of the surgery method for CABG and Other (AVR, VSD and ASD).
Table 5.3 Descriptive Statistics for Electrolyte level, height, and weight of the patients for both group
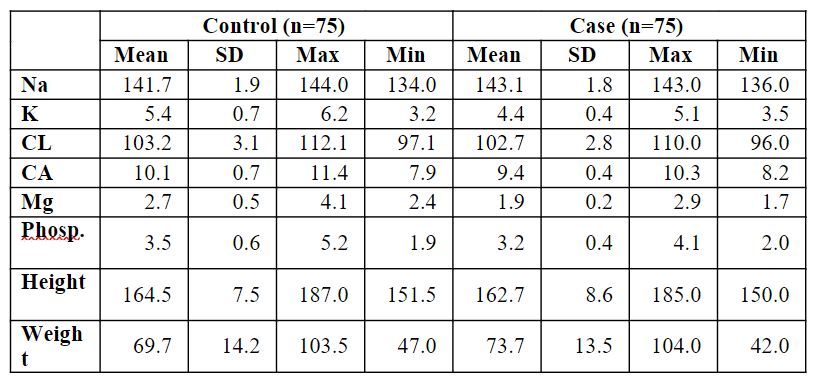
Table 5.3 represents the descriptive statistics such as mean, standard deviation, and maximum and minimum values for Electrolyte levels for the patients. Among the case group of patients, Na has a high normal of 143.1 compared to the control group of patients with a low mean of 141.7. Among the control group of patients, K (5.4), Cl (103.2), Ca (10.1), Mg (2.7) and Phosp. (3.5) has a high mean when compared to the case group of patients K (4.4), Cl (102.7), Ca (9.4), Mg (1.9) and Phops. (3.2) has a low mean. Among the control group of patients, height has a high normal of 164.5 compared to the case group of patients with a common standard of 162.7. Among the case group of patients, weight has a high mean of 73.7 compared to the control group of patients; weight has a low mean of 69.7.
Table 5.4: Mean Electrolyte Level Difference between Control and Case
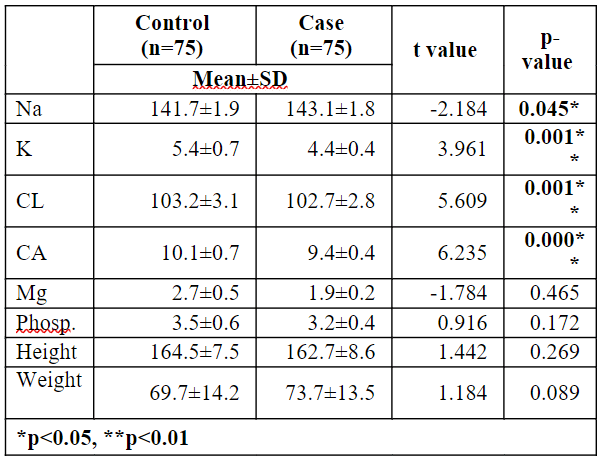
Table 5.4 represents the difference in mean Electrolyte level between the control and case. Among the case group of patients, Na has a high mean of 143.1 compared to the control group of patients, Na has a low mean of 141.7. Among the control group of patients, K (5.4), Cl (103.2) and Ca (10.1) have a high mean when compared to the case group of patients K (4.4), Cl (102.7), and Ca (9.4) have a low mean. Since the p-value for Na (p=0.045<0.05), K (p=0.001<0.01), Cl (p=0.001<0.01) and Ca (p=0.000<0.01) are less than 0.05 level. Hence, it was concluded that there is a difference in the mean of Na, K, Cl and Ca between the control and case. Since the p-value for Mg (p=0.465>0.05), Phosp. (p=0.172>0.05), height (p=0.269>0.05) and weight (p=0.089>0.05) which are greater than 0.05 level. Hence, there is no difference in mean of Mg, Phosp, height and weight between the control and case.
Table 5.5: Difference in mean Electrolyte level between before and after open-heart surgery
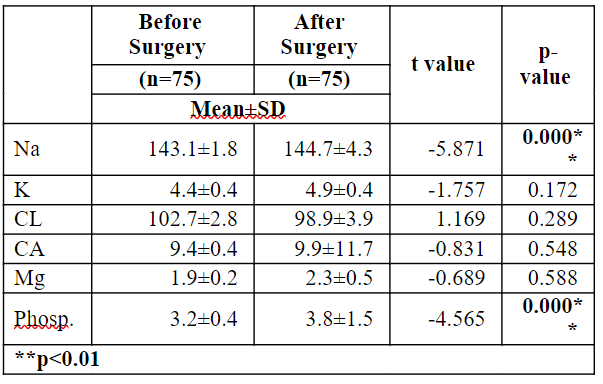
Table 5.5 represents the difference in mean Electrolyte levels before and after open-heart surgery. When considered after surgery, Na has a high mean of 144.7; when compared to before surgery, Na has a low standard of 143.1. When considered after surgery, phosp has a high normal of 3.8; compared to before surgery, phosp has a common mean of 3.2. Since the p-value for Na (p=0.000<0.01) and Phosp (p=0.000<0.01) are less than 0.05 level, it was concluded that there is a difference in mean of Na and phosp between before and after open-heart surgery.
Table 5.6: Association between occupation, Chronic Disease, Drugs, Blood pressure, exercise, alcohol and Smoking and groups
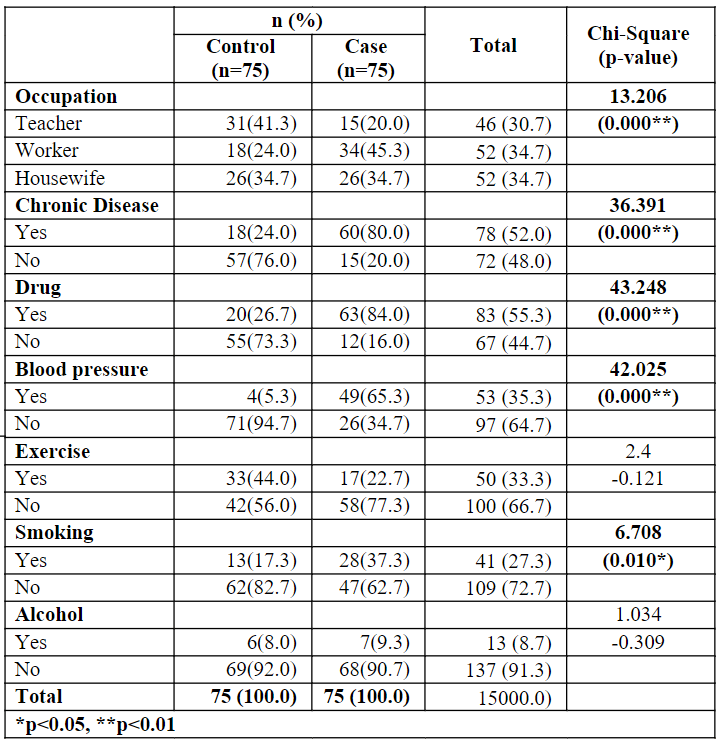
Table 5.6 represents the association between occupation, Chronic Disease, Drugs, Blood pressure, exercise, alcohol and Smoking and groups using the regression method. It is perceived that 34.7% of the patients were workers and homemakers, followed by 52.0% of the patients having a chronic disease, 55.3% of the patients used drugs, 64.7% of the patients didn't have blood pressure, 66.7% of the patients have not to exercise, 72.7% of the patients did not smoke, 91.3% of the patients did not use alcohol.
Further, 41.3% of the control group patients were teachers, while 45.3% of the case patients were workers. 76.0% of the control group patients don't have a chronic disease, while 80.0% of the case patients have a chronic illness. 73.3% of the control group patients did not use drugs, while 84.0% of the case patients used drugs. 94.7% of the control groups of patients don't have blood pressure, while 65.3% of the case patients have blood pressure. 56.0% of the control groups of patients did not exercise while 77.3% of the case patients did not exercise. 82.7% of the control group patients did not smoke, while 62.7% of the case patients did not smoke. 92.0% and 90.7% of control and case groups of patients did not use alcohol. From the chi-square values of occupation (13.206), Chronic Disease (36.391), Drug (43.248), Blood pressure (42.025) and Smoking (6.708) and p-value (p=0.000<0.01), Since the p- values are less than 0.01, it was concluded that there is an association between occupation, Chronic Disease, Drug, Blood pressure and Smoking between control and case.
Table 5.7: Association between Electrolyte level and control and case
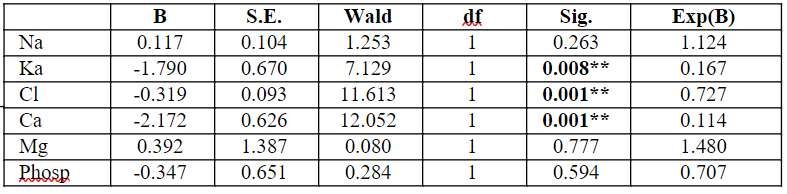
Dependent Variable: Control and Case group, **p<0.01
Table 5.7 depicts the association between electrolyte levels and groups using logistic regression in logistics regression, with electrolyte level as the independent variable and control and case considered as a dependent variable. Since Ka (beta=-1.790, p<0.01), Cl (beta=-0.319, p<0.01) and Ca (beta=-2.172, p<0.01) are less than 0.01. Hence, Ka, Cl and Ca had a negative impact on the control and case groups. While B is suitable for testing the worth of predictors, Exp (B) changes the odds of being easier to interpret. Exp (B) represents the ratio event of interest for a one-unit change in the predictor. Hence there is no association of Ka, Cl and Ca between the control and case groups.
Summary
The results part was used to understand the patient's basic details and used to understand the electrolyte levels of the patients for normal and patients who underwent cardiac surgery. Finally, the statistical test was used to understand the relationship and association between the selected variables related to the study's objectives.
Related Services
Our academic writing and marking services can help you!
Study Resources
Free resources to assist you with your university studies!