
- \ Service
- \ Samples
Vitamin D Deficiency: A Comprehensive Assessment in Saudi Arabia
Subject Area: Education / Adult Learning / Biostatistics
Modified: 21st August 2025
Prices from
£ 149
Rated 4.4/5
- View a Different Grade
- Cite This
- Plagiarism Report
Table Of Content
Referencing Tools
- Harvard Referencing Tool
- Vancouver Referencing Tool
- APA Referencing Tool
S. No
Contents
Page
1
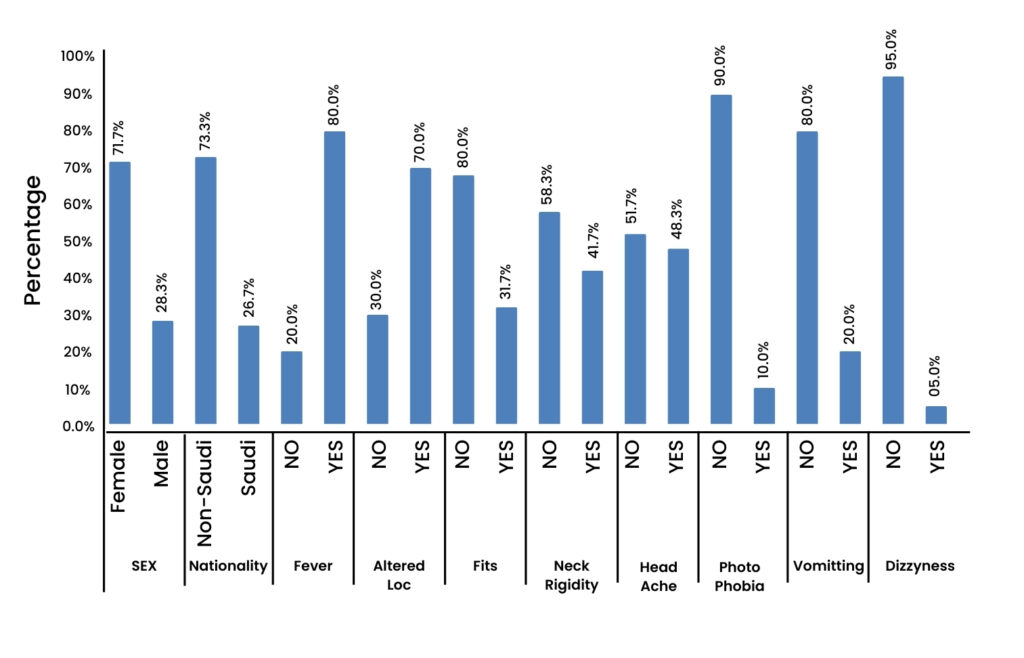
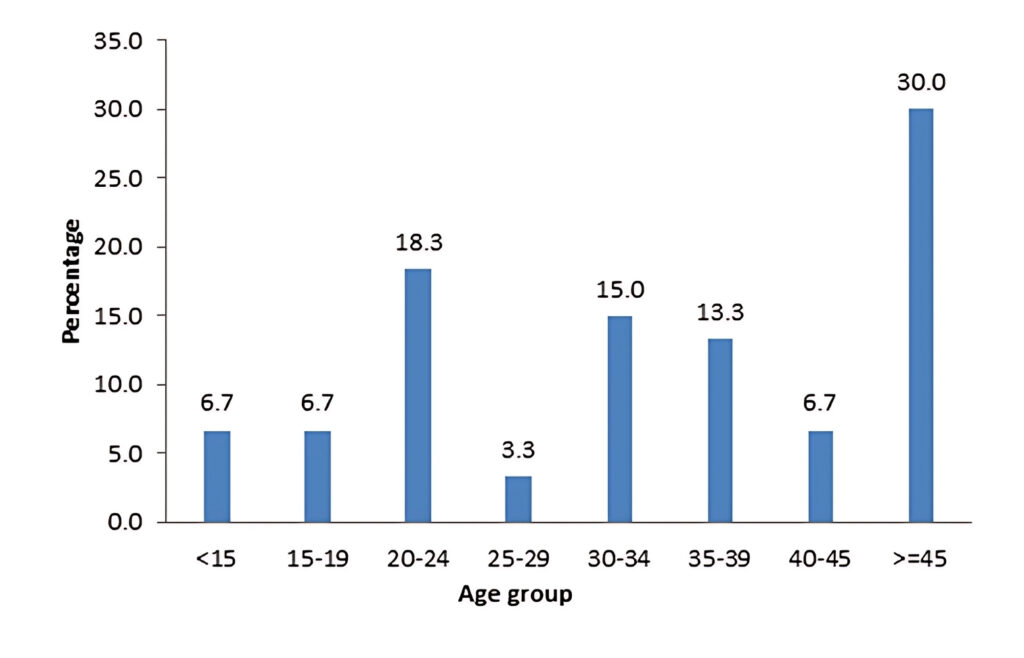
Demographic characteristics of patients
2
2
Area under the curve
3
3
Coordinates of the curve
6
4
Intraclass correlation coefficients (ICC) for CLIA, RIA and HPLC
7
5
Sample coefficient of variation (SCV) values with 95% confidence intervals
7
6
Linear regression analysis
7
7
Two- way ANOVA
7
8
Correlation between Parathormone and alkaline phosphates
7
Demographic characteristics of patients
| Variables | Total (n=200) | p-value | |
| Male | Female | ||
| Sex | 50 (25) | 150(75) | – |
| Age (years) | 48.1±17.0 (14-76) | 44.8±15.7 (3-80) | 0.209 |
| Chemiluminescent immunoassays | 9.2±0.7 (8.3-13.1) | 9.6±6.3 (7.9-86.0) | 0.610 |
| PO4 | 3.7±0.6 (2.6-4.9) | 4.0±2.9 (1.8-39.0) | 0.506 |
| Alkaline Phosphate | 101.6±47.8 (55-302) | 84.9±30.4 (8.0-208.0) | 0.005 |
| Parathromone (pmol/L) | 7.9±3.5 (3.2-19.8) | 6.6±4.2 (1.4-43.9) | 0.039 |
| 25OHD (nmol/L) | 13.3±7.2 (2.0-34.6) | 14.0±14.0 (3.3-150.0) | 0.723 |
| Radioimmunoassay | 8.3±1.6 (3.0-12.0) | 19.4±13.3 (10.0-150.0) | 0.000 |
| HPLC-D3 | 12.4±4.0 (6.0-25.0) | 24.7±14.5 (12.0-150.0) | 0.000 |
The formula for calculating Confidence interval is
C.I = Mean ±1.96 SD
The Average mean of CLIA-RIA is taken in X-axis and difference of CLIA-RIA is in Y-axis. The mean for CLIA-RIA was 20.2 with maximum of 57.0 and minimum of -16.7. We must mean between the maximum and minimum.
Get Help With Your Proposal
Area under the curve
Test Result Variable(s): Chemiluminescent immunoassays | ||||
Std. Error | Asymptotic Sig. | Asymptotic 95% Confidence Interval |
| |
Lower Bound | Upper Bound |
| ||
.000 | .085 | 1.000 | 1.000 |
|
- Under the nonparametric assumption
- Null hypothesis: true area = 0.5
Importance of ROC Curve
Receiver Operating Characteristic (ROC) curves are used in medicine to determine cutoff values for clinical tests, such as the 4.0 ng/ml cutoff for prostate-specific antigen (PSA) in prostate cancer diagnosis. ROC curves help evaluate test accuracy by plotting sensitivity (true positive rate) against 1-specificity (false positive rate). An ideal test has an area under the curve (AUC) of 1.0, indicating 100% accuracy, while a random test has an AUC of 0.5. The ROC curve will help us to determine optimal cutoff values that minimize false positives and false negatives. Sensitivity, specificity, and positive predictive value (precision) are key metrics derived from the curve. Comparing ROC areas between tests can determine the most accurate method.
Coordinates of the curve
| Coordinates of the Curve | ||
| Test Result Variable(s): Chemiluminescent immunoassays | ||
| Positive if Greater Than or Equal To | Sensitivity | 1 – Specificity |
| 6.900 | 1.000 | 1.000 |
| 8.000 | 1.000 | .995 |
| 8.150 | 1.000 | .985 |
| 8.250 | 1.000 | .975 |
| 8.350 | 1.000 | .955 |
| 8.450 | 1.000 | .940 |
| 8.540 | 1.000 | .899 |
| 8.590 | 1.000 | .894 |
| 8.650 | 1.000 | .844 |
| 8.750 | 1.000 | .769 |
| 8.850 | 1.000 | .714 |
| 8.950 | 1.000 | .628 |
| 9.050 | 1.000 | .543 |
| 9.150 | 1.000 | .442 |
| 9.250 | 1.000 | .347 |
| 9.350 | 1.000 | .266 |
| 9.450 | 1.000 | .221 |
| 9.550 | 1.000 | .141 |
| 9.650 | 1.000 | .101 |
| 9.750 | 1.000 | .070 |
| 9.850 | 1.000 | .050 |
| 9.950 | 1.000 | .035 |
| 10.050 | 1.000 | .030 |
| 10.150 | 1.000 | .025 |
| 10.300 | 1.000 | .015 |
| 11.450 | 1.000 | .010 |
| 12.800 | 1.000 | .005 |
| 49.550 | 1.000 | .000 |
| 87.000 | .000 | .000 |
Intraclass correlation coefficients (ICC) for CLIA, RIA and HPLC
| Intraclass Correlation (ICC) (95% CI) | P-value | |
| Single Measures | 0.448 (0.363-0.531) | 0.000 |
| Average Measures | 0.709 (0.631-0.772) | 0.000 |
| Intraclass Correlation (ICC) (95% CI) | P-value | |
| CLIA-RIA | ||
| Single Measures | 0.033 (-0.106-0.171) | 0.319 |
| Average Measures | 0.065 (-0.236-0.292) | 0.319 |
| CLIA-HPLC | ||
| Single Measures | 0.022 (-0.117-0.160) | 0.379 |
| Average Measures | 0.043 (-0.265-0.276) | 0.379 |
| RIA-HPLC | ||
| Single Measures | 0.941 (0.923-0.955) | 0.000 |
| Average Measures | 0.970 (0.960-0.977) | 0.000 |
Sample coefficient of variation (SCV) values with 95% confidence intervals
Variable | Mean | SD | SCV (%) (95% CI) |
Chemiluminescent immunoassays (CLIA) | 9.5 | 5.5 | 57.9 (8.7-10.3) |
Radioimmunoassay (RIA) | 16.6 | 12.5 | 75.3 (14.9-18.4) |
High-pressure liquid chromatography-D3 (HPLC-D3) | 21.7 | 13.8 | 63.6 (19.7-23.6) |
The precision was determined by the Sample coefficient of variation (SCV). RIA has a SCV of 75.3% mean of 9.5 and S.D 5.5, HPLC-D3 had a mean of 21.7, SD of 13.8 and SCV of 63.6% and CLIA has a average of 9.5, S.D of 5.5 and SCV of 57.9%.
Linear regression analysis of the relationship between the absolute differences of CLIA, RIA, and HPLC and their respective means
| Unstandardized Coefficients | t | P-value | 95.0% Confidence Interval | |||
| B | Std. Error | Lower Bound | Upper Bound | |||
| (Constant) | 10.036 | 1.492 | 6.728 | .000 | 7.095 | 12.978 |
| Mean – CLIA-RIA | -1.312 | .101 | -12.994 | .000 | -1.511 | -1.113 |
| (Constant) | 10.080 | 1.645 | 6.126 | .000 | 6.835 | 13.325 |
| Mean – CLIA-HPLC | -1.426 | .095 | -14.984 | .000 | -1.614 | -1.239 |
| (Constant) | -3.069 | .547 | -5.614 | .000 | -4.148 | -1.991 |
| Mean – RIA-HPLC | -.103 | .024 | -4.365 | .000 | -.150 | -.057 |
The non uniformity variability is found using linear regression analysis, in this table it is clear that beta coefficient of Mean – CLIA-RIA where the values are beta=-1.312, t=-12.994, are lesser than p<0.05 and the significance is less than alpha of 0.05 value the null hypothesis is rejected. Thus, there is significant association between HPLC and Difference of CLIA, RIA. The beta coefficient Mean CLIA- HPLC values are beta=-1.426, t=-14.984 are lesser than p<0.05 and the significance is less than alpha of 0.05 value the null hypothesis is rejected. Thus there is significant association between RIA and difference of CLIA and HPLC.
Two- way ANOVA
| Tests of Between-Subjects Effects | ||||||
| Dependent Variable: PARATHROMONE | ||||||
| Source | Type III Sum of Squares | df | Mean Square | F | Sig. | Partial Eta Squared |
| Corrected Model | 3175.700 | 189 | 16.803 | 2.997 | .108 | .991 |
| Intercept | 6694.348 | 1 | 6694.348 | 1194.014 | .000 | .996 |
| AGE | 363.371 | 56 | 6.489 | 1.157 | .489 | .928 |
| SEX | 2.402 | 1 | 2.402 | .429 | .542 | .079 |
| ALKPHOS | 1213.483 | 72 | 16.854 | 3.006 | .108 | .977 |
| AGE * ALKPHOS | 155.494 | 21 | 7.404 | 1.321 | .410 | .847 |
| Error | 28.033 | 5 | 5.607 | |||
| Total | 12572.747 | 195 | ||||
| Corrected Total | 3203.733 | 194 | ||||
| a. R Squared = .991 (Adjusted R Squared = .660) | ||||||
Correlation between Parathormone and alkaline phosphates
| PARATHROMONE | ALKA PHOS | ||
| PARATHROMONE | r-value | 1 | .129 |
| p-value | .072 |