
How to Navigate PhD Data Analytics: A Complete Guide for Successful Research
Introduction
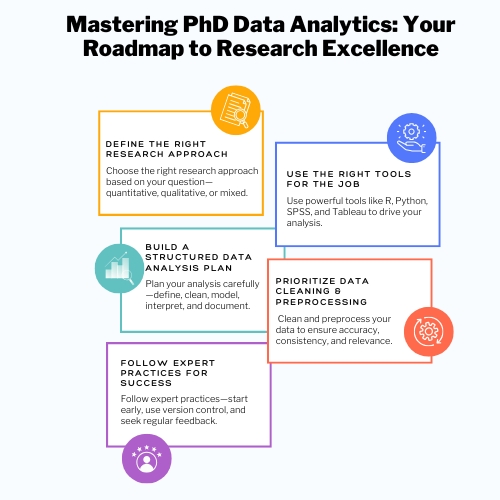
A PhD in data analytics is a challenging but worthwhile experience that combines statistical rigour with cutting-edge computational methods. It gives researchers the power to extract insightful information from difficult and frequently large datasets, no matter whether they’re analyzing social trends, economic indicators, or health systems. In today’s data age, analytical capabilities are not a luxury – they are necessary for delivering valid, high-impact studies that can survive scholarly scrutiny [1].
PhD students today are not just asked to construct theoretical models—they must also use pragmatic, evidence-based methods to solve real questions. This book lays out a clear path through the data analytics process: from deciding between qualitative and quantitative approaches, through designing an effective analysis plan, using the appropriate statistical techniques, and obtaining clean, reliable data. Whether you’re beginning your PhD or wrapping up your dissertation, this guide will assist you in transforming raw data into influential scholarly contributions [2].
What is PhD Data Analytics?
PhD data analytics is the process of applying sophisticated analytical techniques to large and complicated datasets in order to reveal patterns, trends, and associations. A multidisciplinary field where statistics, computer science, and various domains are involved [3].
Key Tools & Techniques:
Tool/Technique | Description | Example Use Case |
R & Python | Programming languages with rich data analysis libraries. | Statistical modeling, machine learning [4] |
SPSS & SAS | Software for statistical analysis and data management. | Survey data analysis, hypothesis testing [5] |
Tableau & Power BI | Data visualization software that helps with interactive dashboards. | Business intelligence reporting [6] |
SQL & NoSQL | Database management systems that can handle structured and unstructured data. | Data extraction and manipulation [7] |
Machine Learning Algorithms | Methods such as regression, classification, clustering. | Predictive modeling, pattern recognition [8] |
Applications:
Selecting Between Qualitative and Quantitative Analysis for Your PhD
Your choice of the right research method is important for your success at PhD level. Knowing the differentiation between qualitative and quantitative analysis will inform your decision [3].
| Qualitative Analysis | Quantitative Analysis |
Purpose | Investigates underlying reasons, opinions, and motivations | It quantifies variables and generalizes results from a larger sample population. |
Methods | Interviews, focus groups, content analysis | Surveys, experiments, statistical modeling |
Data Type | Non-numeric, textual or visual | Numeric, structured |
Strengths | Gives in-depth understanding of complex phenomena | Allows for statistical analysis and hypothesis testing |
Limitations | Subjective interpretation, smaller sample sizes | May overlook contextual details |
Choosing the Right Approach:
How to Design a Data Analysis Plan for PhD Research
- Data Cleaning: Define procedures for dealing with missing values, outliers, and inconsistencies [7].
- Analysis Techniques: Appropriate statistical or analytical methods are to be selected [8].
- Interpretation: Plan for interpretation in terms of research questions [5].
- Reporting: Describe how results will be presented, including any visualizations or summaries [4]
Example:
For research into the effect of social media on grades, for instance, quantitative research with a survey and statistical analysis could be used. In data cleaning, missing responses would be checked as well as outliers, then there would be regression analysis to show correlations. There would be presenting of results through charts and tables to display prominent findings.
Statistical Methods Commonly Used in PhD Thesis
Statistical methods for data analysis enable credible outcomes [10].
Common Statistical Techniques:
- Descriptive Statistics: Measurement descriptive statistics such as mean, median, mode summarize data [6].
- Inferential Statistics: Infer from a sample into the population based on t-tests, ANOVA [3].
- Regression analysis: The study of relationships between the variables [4].
- Factor Analysis: Finds hidden variables explaining the data [8].
- Survival Analysis: How it relates to time to event [7].
Selecting the best Statistical Test:
Role of Data Cleaning and Preprocessing in Academic Research
Enhance Your Study with Professional Assistance
Following your academic ambitions? PhD Assistance is there to provide you with customized expert support at any stage of your research journey. Whether you require direction or assistance with the entire process, we are here to assist you in being successful. Call us today to learn how we can support your academic success!
Example:
In a students’ grades dataset, the missing values can be filled using the mean grade, outliers can be detected using box plots, and gender is just one of the many categorical features encoded through one-hot encoding. These procedures ensure the cleansing, unification, and preparation of the dataset for strong statistical inference or machine learning modelling [11].
Failure to address data cleanliness brings wrong results, model bias, and results that are less credible – particularly for PhD-level work, where accuracy and replicability are paramount.
Final Tips from PhD Analytics Mentors
- Early Start on Your Data plan – Do not wait until after collecting data to decide how you are going to analyze it.
- Version Control is Your Friend – Use GitHub or Bitbucket to track code, data, and writing.
- Document Every Decision – Record each variation in your preprocessing or modeling for transparency.
- Seek Feedback Often – From colleagues, superiors, and statisticians.
- Participate in Analytics Communities – LinkedIn groups, Reddit forums, and conferences are goldmines for help and new concepts.
Conclusion: Your Path to Data-Driven Discovery
Data processing at the Ph.D. level is a very rigorous course, emphasizing on technical acumen combined with strategic thinking and innovative insight. This is in mastering tools like R, Python, Tableau; selecting the method that is relevant to the purpose; clean and structured data, which would then foray much deeper into effective research.
PhD Assistance Website is involved in mentoring doctoral research candidates through every process in the analytics, Hypothesis to defense. Your data shall speak in a unified, credible, and scholarly voice with our help.