
Profit-Shifting and Bunching Responses to the UAE Corporate Tax Qualifying Free Zone Regime: A PhD Topic Blueprint for Accounting and Finance Scholars
- Why this is a research problem, not a polemic
- The threshold is firm-specific — the single most important design fact
- A notch, not a kink
- Designing the bunching estimator
- Designing the profit-shifting test
- What bunching cannot tell you
- Threats to identification
- Data: the binding constraint
- Governance and the limits of the claim
- Study design checklist
- Research questions
- Study design checklist

Recent Post
“Is the free zone regime a loophole?” is a polemic. This is answerable: the regime contains a sharp discontinuity; discontinuities leave a measurable signature in the distribution of firms, and a scholar can specify in advance what that signature would and would not prove.
Who is this for: PhD scholars in accounting, finance, public economics and tax policy; and supervisors scoping empirical tax projects in the UAE and GCC.
Scope. This article separates published evidence, cited to source, from research hypotheses, labelled as such, and design guidance. It is research-methodology guidance only. It is not tax advice, no guidance on structuring, compliance or threshold management, and not a suggestion that any firm has done anything improper. Readers with a tax position should consult a qualified adviser.
1. Why this is a research problem, not a polemic
UAE corporate tax applies 0% to taxable income up to a Cabinet-specified amount and 9% above it; a Qualifying Free Zone Person (QFZP) instead pays 0% on Qualifying Income and 9% on income that is not Qualifying Income [1]. That creates two tax prices for the same activity — the raw material of an empirical tax thesis. How firms respond is not established, and response is an empirical quantity, estimable provided the design states beforehand which response it can detect.
2. The threshold is firm-specific — the single most important design fact
A Free Zone Person qualifies only if it maintains adequate substance, derives Qualifying Income, has not elected into standard taxation, and complies with the arm’s length and documentation provisions [1]; Qualifying and Excluded Activities are set by ministerial decision, most recently Ministerial Decision No. 229 of 2025, which repealed the 2023 decision [2]. The condition that carries the identification is the de minimis requirement: non-qualifying revenue must not exceed the lower of 5% of total revenue or AED 5,000,000 [3,4]. The threshold is therefore not a universal 5% line. It is firm-specific, and which limb binds depends on size:
Firm | Total revenue | 5% limb | AED 5m limb | Effective threshold |
A | AED 60m | AED 3m | AED 5m | AED 3m — 5% binds |
B | AED 150m | AED 7.5m | AED 5m | AED 5m = 3.33% — the cap binds |
The crossover sits at AED 100m of total revenue. Below it, the percentage limb binds; above it the absolute cap binds, and the equivalent percentage falls steadily as the firm grows. A design that pools firms on “5% of revenue” as a common running variable is mis-specified for every firm above AED 100m, which is precisely the population most relevant to a profit-shifting question. Recentre each firm on its own effective threshold before pooling anything.
3. A notch, not a kink
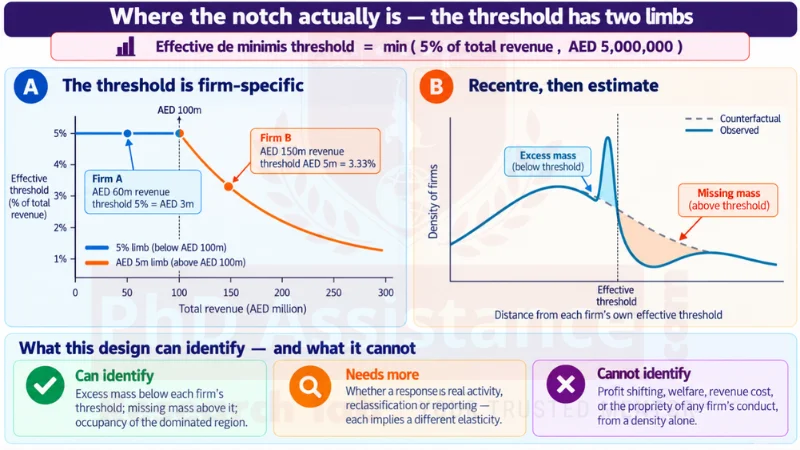
Research-design schematic titled “Where the notch actually is — the threshold has two limbs”, labelled as illustrative shapes only, with no data, no estimate and no calculation of any firm’s liability. A subtitle states that the effective de minimis threshold equals the lower of 5% of total revenue and AED 5,000,000. Panel A plots the effective threshold as a percentage of total revenue against total revenue in AED millions: it is flat at 5% up to AED 100 million, where the 5% limb binds, then falls along a curve above AED 100 million, where the AED 5 million cap binds. Two firms are marked — Firm A with AED 60 million of revenue and a threshold of 5% or AED 3 million, and Firm B with AED 150 million of revenue and a threshold of AED 5 million, equal to 3.33%. Panel B plots the density of firms against distance from each firm’s own effective threshold, showing a smooth counterfactual density and an observed density with excess mass just below the threshold and missing mass above it. A closing panel states what the design can identify, what needs further evidence, and what it cannot identify, including profit shifting, and notes that both panels are drawn rather than estimated and that nothing shown is tax advice.
Where the notch actually is — a research-design schematic. Both panels are drawn, not estimated; no data has been used and no bunching is claimed.
Failing the de minimis requirement does not tax the marginal dirham at 9%. The person ceases to be a QFZP from the beginning of that tax period and for the four subsequent tax periods [4]. Crossing the de minimis threshold can therefore produce a discrete change in tax liability, because the entity loses QFZP treatment for the relevant tax period and the following four tax periods. The size of that liability change depends on the entity’s taxable income and the standard Corporate Tax rules that apply after QFZP status is lost.
That structure is the design. A kink changes the marginal rate; a notch changes total liability, creating a region just above the threshold where firms would be strictly better off earning less [6]. Notches produce sharper, more detectable bunching than kinks — and a dominated region whose occupancy is itself informative.
4. Designing the bunching estimator
Bunching methods provide an established framework for estimating behavioural responses around tax kinks and notches, subject to appropriate specification of the counterfactual distribution: fit a counterfactual density from the observed distribution, excluding a window around the threshold, then measure excess mass below and missing mass above [5,7]. Each step is a decision to prespecify.
Decision | Options | What turns on it |
Running variable | Distance from each firm’s own effective threshold, in dirhams or normalised | Pooling on a flat 5% mis-specifies every firm above AED 100m |
Excluded window | Width either side of the threshold | Too narrow understates bunching; too wide absorbs the counterfactual |
Counterfactual | Polynomial fit; alternative functional forms | The estimate is only as credible as the counterfactual |
Inference | Bootstrap over residuals | Conventional standard errors understate uncertainty |
Dominated region | Share of firms located there | Reveals optimisation frictions, not just responsiveness [6] |
Sample period | Split at the 2025 activity-definition change [2] | A sample spanning it mixes two policy regimes |
The identification path, in order. Establish which limb binds for each firm → recentre the running variable on that firm’s threshold → prespecify window, counterfactual and bootstrap → estimate excess and missing mass → read the dominated region for frictions → only then ask about mechanism. Skipping to the last step is the commonest way the design fails.
5. Designing the profit-shifting test
The title promises a second margin, and it needs its own design rather than an inference from the first. Bunching is evidence of a distributional response to the threshold; it is not, by itself, evidence of profit shifting.
- Reported profit, or profit per unit of real input, in the free zone entity relative to related entities taxed at the standard rate.
- Membership of a related-party group spanning both tax prices, where reallocation is mechanically possible.
- Data required. Linked related-party accounts or transfer-pricing documentation. A single-entity dataset cannot support this test at all, and saying so early is a feasibility finding, not a weakness.
- Compare profit allocation across entity pairs that differ in tax price but not in real activity, using the regime’s own introduction or the 2025 definitional change [2] as the source of variation.
- Real inputs — employment, assets, tangible activity — so that a reallocation is not confused with growth.
- Intra-group pricing, service and royalty charges, and debt placement are distinguishable only with the documentation that records them.
- Reported profit reflects both reallocation and real location. Without inputs, the two are observationally equivalent. The international measurement literature [8] provides background on the scale of the phenomenon in other jurisdictions; it is not evidence about UAE firms and should not be cited as if it were.
6. What bunching cannot tell you
Excess mass establishes that firms respond, not how. Real adjustment, reclassification between qualifying and non-qualifying categories, and reporting choices all produce bunching, and imply different elasticities. Separating them needs auxiliary evidence — activity codes, related-party flows, enforcement variation — and a design that cannot separate them should say so rather than assert its preferred interpretation.
7. Threats to identification
Optimisation frictions. Adjustment costs mean observed bunching understates the frictionless response; the dominated region is the diagnostic [6].
Round-number heaping. Revenue figures cluster at round values for non-tax reasons. Test whether the threshold mass survives controls for heaping.
Confounded thresholds. If another rule binds near the same point, bunching is not attributable to this one. Map every threshold in the firm’s regulatory environment before claiming attribution.
Regime change. Activity definitions changed in 2025 [2]. Treat the periods before and after as separate regimes, state the break date in the sample description, and either estimate them separately or justify pooling explicitly.
8. Data: the binding constraint
This is the feasibility gate, to be settled before the proposal is written. Public access to UAE firm-level Corporate Tax return microdata is not established in the sources reviewed for this research design, and no documented research-access route to return data was identified. Work down this order: negotiated administrative access, with a named custodian and written request; commercial firm-level databases, acknowledging coverage limits; hand-collected filings for listed or large entities, with the selection rule stated. If none is achievable, the bunching design is not feasible as stated and the thesis becomes a design and institutional-analysis contribution — defensible if declared, not if discovered late.
9. Governance and the limits of the claim
Confidential firm data carries disclosure-control obligations: state what is reported at what granularity, and never identify a firm. Secondary analysis may require institutional ethics review. And state what the estimate does not speak to. A density tells you about behaviour, not welfare, revenue cost, or the propriety of any firm’s conduct. Converting a bunching estimate into a verdict on the regime is the error most likely to end badly at viva.
10. Study design checklist
Dimension | Evidence to hold before submission | Risk if unresolved |
Threshold mapping | Both de minimis limbs, read from the instruments [3,4] | Running variable mis-specified |
Data access | A named source and a written route | The commonest feasibility failure |
Counterfactual | Prespecified window, functional form and bootstrap | The estimate reduces to a modelling choice |
Mechanism | A stated plan to separate real, reclassification and reporting responses | An elasticity reported without knowing what it measures |
Confounders | A map of every nearby regulatory threshold | Attribution to the wrong rule |
Disclosure | Reporting granularity agreed in advance | Breach of the data agreement |
11. Research questions, and what identifies each
RQ1 (primary): is there excess mass immediately below each firm’s own effective de minimis threshold, relative to a prespecified counterfactual density? Estimation, not hypothesis testing. RQ2: what share of firms locates in the dominated region, and what does that imply about optimisation frictions [6]? RQ3: does bunching differ by sector, size or free zone? RQ4 (exploratory): is there evidence consistent with reclassification rather than real adjustment? RQ5 (exploratory): conditional on linked related-party data, is profit allocation associated with the tax-price difference across entities within a group?
RQ | Running variable | Outcome | Data needed | Main threat |
RQ1 | Distance from own effective threshold | Density of firms | Firm-level revenue split | Counterfactual mis-specification |
RQ2 | Same, above threshold | Share in dominated region | Same | Measurement error at the threshold |
RQ3 | Same, by stratum | Excess mass by sector, size, zone | Plus firm characteristics | Thin cells; multiple comparisons |
RQ4 | Same | Activity vs category composition | Plus activity codes | Reclassification unobservable |
RQ5 | Group tax-price difference | Profit allocation across entities | Linked related-party accounts | Real location confounds reallocation |
12. Contribution, and what a reviewer will ask
A completed thesis would deliver a documented map of both threshold limbs; a bunching estimate with a prespecified counterfactual and bootstrap inference; a frictions estimate from the dominated region; and a statement of which behavioural margin the design can and cannot separate. Data coverage bounds generalisation, and no conclusion about any individual firm is supportable.
Common weaknesses that require revision: a threshold taken from secondary commentary; a flat 5% running variable applied to large firms; a counterfactual chosen after seeing the data; bunching interpreted as profit shifting without a design for it; data access assumed; and a policy verdict the design cannot support.
Need a methodology review for your empirical tax study?
If you are unsure whether your bunching design would survive a counterfactual-specification challenge, or whether your data route is realistic, a methodology review is the place to settle it.
Start an empirical-tax methodology consultation with PhD Assistance’s research-methodology team: a research-design review of your topic, data plan and identification strategy, delivered as a written recommendations summary for a supervisor meeting. The consultation advises on methodology; you carry out the research, and it provides no tax advice.
Related support: PhD research proposal development · PhD data analysis and statistics · PhD literature review support
Frequently Asked question
No. The threshold is the lower of 5% of total revenue and AED 5,000,000, so above roughly AED 100m of total revenue the absolute cap binds and the equivalent percentage falls below 5%. Pooling on a flat 5% line mis-specifies the running variable for exactly those firms. Recentre on each firm’s own effective threshold first.
A discontinuity identifies a response from the distribution of firms alone, without a control group. A rate that applies broadly leaves no comparable local signature.
Partly. Commercial databases and filings can support a bunching design for covered firms, if coverage limits and selection are stated. Settle this before writing the proposal.
No. Bunching shows firms respond to a threshold, which is what thresholds do. Attribution to avoidance or to profit shifting requires evidence on mechanism, and no such claim should be made about an identifiable firm.
Reference
- United Arab Emirates. Federal Decree-Law No. 47 of 2022 on the Taxation of Corporations and Businesses, Arts 3, 18 and 19. Ministry of Finance. https://mof.gov.ae/wp-content/uploads/2022/12/Federal-Decree-Law-No.-47-of-2022-EN.pdf
- Ministry of Finance, United Arab Emirates. Ministerial Decision No. 229 of 2025 regarding Qualifying Activities and Excluded Activities. Issued 28 August 2025; repeals Ministerial Decision No. 265 of 2023. https://mof.gov.ae/wp-content/uploads/2025/09/EN-Ministerial-Decision-No.-229-of-2025-Regarding-Qualifying-Activities-and-Excluded-Activities.pdf
- United Arab Emirates Cabinet. Cabinet Decision No. 100 of 2023 on Determining Qualifying Income for the Qualifying Free Zone Person. Ministry of Finance. https://mof.gov.ae/wp-content/uploads/2023/11/Cabinet-Decision-No.-100-of-2023-on-Determining-Qualifying-Income-for-the-Qualifying-Free-Zone-Person.pdf
- Federal Tax Authority, United Arab Emirates. Corporate Tax Guide: Free Zone Persons (CTGFZP1). May 2024. https://tax.gov.ae/Datafolder/Files/Guides/CT/Free%20Zone%20Persons%20-%2020%2005%202024%20final%20for%20GCD.pdf
- Saez E. Do taxpayers bunch at kink points? Am Econ J Econ Policy. 2010;2(3):180–212.
- Kleven HJ, Waseem M. Using notches to uncover optimization frictions and structural elasticities: theory and evidence from Pakistan. Q J Econ. 2013;128(2):669–723. doi:10.1093/qje/qjt004
- Kleven HJ. Bunching. Annu Rev Econ. 2016;8:435–464. doi:10.1146/annurev-economics-080315-015234
- Tørsløv T, Wier L, Zucman G. The missing profits of nations. Rev Econ Stud. 2023;90(3):1499–1534. Cited as international background on the scale of profit shifting; not evidence about UAE firms.