Technology Acceptance Model(TAM)
What is Technology Acceptance Model(TAM)
The technology acceptance model is an extension of TRA introduced by Davis. TAM explains the acceptance level of individual to information technology (Davis, 1986). The objective of TAM is providing a description of determinants of computer acceptance among the users. The two of the technology acceptance measures along with attitudes of TRA substituted TAM. Firstly, it is the perceived usefulness that denotes to the rate of an individual believing to use a particular system that improves his/ her job performance.
Secondly, perceived ease of use (PEOU) denotes the rate at which an individual believes in utilizing specific system that would be free from efforts (Davis, 1989). The TRA’s subjective norms are not subjective to TAM determining BI. The Figure 9 given below presents the original theory behind TAM that comprises the attitude elements.
Anyhow, on the basis of practical evidences, the concluding model excludes the attitude as it does not concentrate on the effect of PEOU intensively and PU→BI was regarded much important (Davis et al., 1989).The theory of acceptance model assumes that PU is a characterized by PEOU, as when others are equal, it makes easier to use technology. Compatible with TRA, TAM insists the effect of external variables to be resolved by PEOU & PU.
Figure 9: Technology Acceptance Model
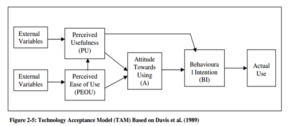
Source: Davis et al (1989)
The model proposed by Davis et al., (1999) identified Technology Acceptance Model. This model identified that actual use was dependent on the behavioural intention of an individual which was in turn impacted by the attitude towards usage. The two different attributes which determine the attitude towards usage werePerceived usefulness and Perceived ease of use which is moderated by external factors.
The external variables in the above model denote to the set of elements which are characteristics, training, computer self-efficacy, objective system design, user involvement in design and the nature of implementation process (Davis, 1996). Nevertheless, with the evolvement of TAM, there were introduction to new variables affecting the external variables such as PU, PEOU, BI and actual use or behaviour. The often referenced variables were system quality, compatibility, computer anxiety, enjoyment, computing support and experience (Lee et al., 2003).
The association of the TAM’s four major variables PU, PEOU, BI and behaviour is theorized to utilize PU as both dependent variable and independent. The former affects the BI directly and the latter is predicted by PEOU. The original usage or behaviour is actually determined by amount of time usage, frequency of usage, actual number of usages and diversity of usage.
Studies on TAM
- Explanatory power of the model
- Inconsistency in the degree of relationship among the established constructs
The authors were found to examine data from fifty five different articles which were identified from different databases based on specific selection criteria. Their examination identified the vulnerability which is associated with explanatory power in two distinct sections: Low explanatory power of about 40% of models (Sun & Zhang. 2003; Venkatesh et al., 2003) and differences in the explanatory power due to type of method used (for example, field versus experimental studies).
When experimental studies are conducted they are often representative of convenience sampling measures wherein a group of students or a specific group of professionals in one field are chosen. This is not representative of a real workplace scenario. In contrast when field studies are conducted they are often done in one shot again making it not representative of the real work place scenario (Sun & Zhang, 2003). It can be concluded that to overcome this limitation it is vital to adopt a longitudinal approach wherein the change in perception of people can be examined right from introduction to the technology and the actual degree of usage after they become accustomed to the technology given to them.
The degree of inconsistency between the major constructs of the pattern has been identified. It is pointed out that in some cases the relationship between the constructs showed statistical significance making the implementation of the TAM model a robust and reliable model. , there have been cases where there is no significance obtained when tested statistically.
As an example when the PEOU construct is considered it is observed that the effect on attitude, behaviour intentions as well as degree of usage was inconsistent but PEOU and PU relationship was significant and still there were certain cases where this was not observed. These reasons were attributed to the type and experience of the user. A more experience user would have varying intellectual capacities and this could be reflected on their degree of perception on PEOU and PU.
From a detailed meta-analysis certain limitations were identified by Lee et al., (2003). They identified that most TAM models used a single information system or a single type of subject such as a single company, department, students, a onetime cross sectional study or a one type of task testing during testing of an information system. In an attempt to overcome these limitations, TAM2 was developed to cover for the absence of moderators in the original TAM.
The origin of TAM in comparison to the original was during the past twenty years. Wixom & Todd (2005) clarified the extension of TAM in three significant methods. The initial approach includes the factors that exist from the relative models (for example, SN & PBC from TPB). Secondly, it involves introducing additional or substituting beliefs to the model which are basically from diffusion of innovation theory such as trilability, compatibility, visibility or result demonstrability. Thirdly, it involves investigating external variables that cause an effect on PEOU & PU like personality traits and demographic characteristics.
Han (2003) identified that with the advent of introducing TAM, they have advanced through the three phases of development which are adoption, validation and extension. The adoption phase investigates TAM and synthesizes the various information system applicationssuch as key office applications including spreadsheet, Lotus 1-2-3, Word Perfect, Word, Excel; communication technologies such as emails, voice mail, customer dialup system and Fax; database systems; microcomputer; workstations; telemedicine technologies; and Internet–related IS applications such as www information services, online services, virtual workplace systems, digital libraries.
There were many organizations of different cultures which are American financial institute, Canadian integrated steel company, accounting firms, public hospitals in Hong Kong, investment banks. The probation phase of TAM underwent two directions
The first to validate TAM’s PU & PEOU instruments to compromise on psychometric properties and the next one to establish the concerned connections among the TAM component elements. There are again two divisions of the extension phase which can be branched in to two phases; the first one to extend the two major constructs (PU & PEOU) and the second one to incorporate relevant variables as significant antecedents of the two constructs PU & PEOU (Han, 2003).
On the basis of the meta-analysis formulated by Lee et al. (2003), the origin of TAM (1986-2003) can be separated into four periods which are introduction, validation, extension and elaboration. Consequently, the introduction of TAM in the year 1989 based on the concepts of TAM was presented in two different directions.
The first direction was with respect to promotion of replication of TAM with other technologies to determine the closeness. For instance, Adams et al. (1992) investigated TAM in five various applications which are word processors, graphics, spreadsheets, e-mails and v-mail and identified that, in general, TAM maintained its consistency and validity in explaining users’ acceptance of information technology.
The other direction was to compare TAM with TRA in order to differentiate the new and the original model and prove the superiority of the latter to the original. In the previous section (2.4.1), the example of the work on DTPB was compared with TAM and the original TPB. Taylor and Todd (1995b) identified that DTPB and TPB justified the definition of TAM.the findings have to interpret with caution due to the trade-off between explanation power and complexity.
TAM is more stringent than DTPB comprising of eight more variables. Davis et al. (1989) examined TRA with TAM in aspects of how the both models are manipulated by MBA students’ relative facility with word processors across two time frames, soon after the introduction of the system and 2 weeks later. They identified that TAM could describe the user’s intention than what TRA performs. The researchers based on the model wanted to prove that TAM could genuinely make use of accurate manipulations of user’s acceptance and behaviour presentedby various technologies, situations and work.
As discussed earlier, Adam et al. (1992) reproduced and further stretched the Davis’ (1989) study by investigating the application of the two factor model (PU & PEOU) to two various divisions of messaging techniques (electronic and voice mail) in 10 different organizations. This study had anoverall totalof 118 users in first study and a complete sample of 73 student users of Lotus1-2-3, WordPerfect, and Harvard Graphics in the second study and identified that both validity and reliability of PU and PEOU values across many settings.
Segar & Grover (1993) identified that the outcomes of Adams et al.s’ (1992) experienced a measurement problem and until the measurement model formulates the existing relationship between the observed values and the prevailing elements in a dependable and relevant manner their application in examining structural relationship could lead to equivocal outcomes (Chin & Todd, 1995). Segar & Grover moved ahead to postulate an example in application of confirmatory factor analysis (CFA) to Adam et al.’s data.
This was re-evaluated using PEOU & PU scale and came to a conclusion that there were measurement issues. When the PU factor is divided in to two dimensions, it resultedin a three-factor model for Davis’ TAM (PEOU, PU and effectiveness). Consequent to the report, Chin & Todd (1995) disapproved Segar & Grover’s (1993) findings declaring that though there were foundations to criticise Adam et al.’s work, the logical thinking to apply classical statistic techniques were not possible.
The authors criticized the inclusion of the third factor (effectiveness) of the model demanding that there wasn’t substantive theoretical reasoning underlying or any differences between the PU and effectiveness construct and purpose to serve statistical considerations. Soon after the thorough analysis of Adams’ et al. (1992) data and fresh independent set of information, Chin & Todd illustrated that Davis’ (1989) usefulness construct possessed rationale psychometric property and had no logical support or any substantive reason to divide the elements into two dimensions.
The research studies during the probation period were mainly targeted on to analyse the reliability and validity of TAM tools. Segal & Grover (1993) put forth that the absence of appropriate measures of PU & PEOU along different technologies and organizational aspects needs careful attention to interpret the concepts that are adjunct to use of technology.
Extensive research was conducted to introduce new variables to enhance the relationship underlying TAM elements. The limitation of TAM includes contradictory relationship among the constructs (Sun & Zhang, 2006). According to the mentioned authors, they felt it is better to include moderators to sweep over such limitations. They also indicated that there are various studies who pointed out for few moderator characteristics (for example, Venkatesh et al., 2003; Agrawal & Prasad, 1998).
Venkatesh et al. (2003) examined 8 models which were utilized to explain technology acceptance behaviour and identified that through prediction; about six to eight models were seen to rise after adding moderators. They argued that it was evident that this addition of moderators to different models in past research fairly enhances the predicted validity of many models above the required specifications (Venkatesh et al., 2003).
The inexistence of the moderating influences in TAM was specifically criticized by Agrawal & Prasad in relation to identify few more research examining the effect (Sun & Zhang, 2006). Agrawal & Prasad (1999) increased TAM by examining the resolving effect of individual differences specifically a role in relation to technology, possession in workforce, education level, previous experiences and the training involvement of external variables between PU and PEOU beliefs, attitude and behavioural intentions.
It was identified that the five individual characteristics composed only three of significance to PEOU. The other two which showed no effects only involved in training and possessing workforce and it comprised no significant effect on PU. In correspondence to PU belief, only training involvement showed direct significance whereas, the others showed indirect effect with the PEOU belief due to the anticipation of PEOU- PU relationship with TAM.
The subsequent effects to increase the TAM model were devoted to find the boundary conditions of TAM and along with, the culture and voluntary versus required setting were investigated. The statistics which need to be considered are education, age, gender, experience and this would be directed to moderators for creating relations to the models (Lee et al., 2003).
The evolution of TAM proceeded and in the elaboration period, research studies of TAM were continued to create new versions that accomplished the external elements influencing PU & PEOU and it justified all the limitations of past studies. For instance, in one year period Venkatesh and Davis (2000) examined the determining elements of TAM’s constructs PU & PEOU. Along with, they also examined the determinants of PU and presented a fresh model which was called as TAM2 as discussed in section (2.6).
The same year Venkatesh (2000), put forth his work to analyse the PEOU determinants along with the specific system (During the initiation and after obtaining experience with target system) and formulated the control/adjustment–based theoretical model. This model intended a group of anchors which are control processes that could be external or internal and external that was interpreted as computer efficacy and established their adjunctive conditions.
The intrinsic motivation was established as computer playfulness and emotions were established for computer interest. An individual is expected to regulate his/her PEOU though the anchors are characterised by the previous PEOU of a developed system and this is due to increased experience with the system. The model was further investigated in three various organizations which used three measurements manipulated over three months-period.
The obtained outcomes identified that the proposed model of determinants of PEOU clearly described 60% variance in PEOU.The derived results the basic drivers of system-specific PEOU are increasingly individual difference variables and situational characteristics that with these effects grow even stronger absolutely with experience. This research was an answer to TAM’s beliefs that were unified to the effect of external variables exclusively with the TAM constructs of PEOU & PU (Venkatesh, 2000).
After three years, in the year 2003, Venkatesh et al built a complete model comprised of eight models utilized to describe the technology acceptance behaviour. The new model was renamed as unified theory of acceptance and use of technology (UTAUT) as discussed in section (2.11)
Sun & Zhang (2006) came up with his concept to extend TAM and implied his ten moderating factors that were classified into three divisions which are organizational factors, technological factors and individual factors. The organization factors indicate the willingness and nature of profession, technological factors that are involved technology complexity, individual vs. group technologies, work vs.
Entertainment and finally individual moderators including culture, age, experience and intelligence of an individual. All these factors are to be examined within the TAM. The proposed integrated comprises the PU, PEOU and SN variables in addition to the three groups of moderators. Table 2 summarizes some of the main relevant research related to TAM.
Prior to introducing information system, TAM was developed for the organization and it was identified that there were vast differences between Davis’ approach and Aizen’s approach. TAM is proposed by IS inhabitants and was formulated in IS field and the development of TRA and TPB subsequent to the psychology field.
Over the last twenty years, TAM has gained well acceptance as vigorous, efficient tool to forecast the acceptance of individual on emerging technologies. About 424 journal citations of the two articles were presented for TAM (i.e., Davis 1989; Davis et al., 1989) based on the Social Science Citation Index® (Venkatesh & Davis, 2000). , The model is not without disadvantages which are discussed in the next chapter.
Demerits of TAM
-
- The main limitation which has been associated with the use of Technology Acceptance model is the degree of self-reporting which is involved. In this model acceptance is dependent on self-reporting and model is built on the assumption that reporting actually reflects the degree of usage
- Feedback with respect to usefulness and perceived ease of use is presented still other aspects such as flexibility, degree of integration, completeness of information presented and current nature of information is not available
- These guidelines were also presented during the development of the TAM model but were sadly not discussed in depth by any researcher (Davis et al., 1989).